Results of survey
Voters' Sources of Information for 2009 City Council election
(Palo Alto CA)
Contact
The sponsor of this survey was Palo Alto Neighborhoods (PAN).
The primary contact for these results is Douglas Moran (DougMoran.com).
He is the primary author of this report, conducted the actual survey,
and was the coordinator of the design of the survey.
Introduction
This survey attempts to capture which sources of information were used by voters
in the 3 November 2009 Palo Alto City Council election,
and how useful they found those sources.
It was structured to be of use by candidates in future Palo Alto elections
to use in deciding how to apportion their efforts and resources (time and money).
If you have background information to better put the results into context,
please send that information to the above contact.
We will also consider significant analyses of these results for posting alongside this report.
There were 339 responses.
In viewing these results, it is important to remember that the respondents were self-selected on two levels.
The obvious level is that these are the people who chose to respond.
The often forgotten level is these are also people who chose to follow the information channels where this survey was announced.
Women were over-represented among respondents,
a situation that was also seen in the 2007 survey (below).
Also over-represented were those ages 56-65.
We did not explore differences between the demographic groups,
but if you wish to do so, the raw data is available.
The respondents expressed significant dissatisfaction with most of the information sources,
both in their comnents and their ratings of those sources:
Only 25% (8 of 32) had averages above the scale's mid-point.
There seemed to be a strong desire for more and better information about the candidates.
However, the sources that people listed as their most useful were heavily loaded with ones
that provide only very limited information,
for example, the brief candidate statement in the Voter Guide.
Candidate brochures were both widely reviled and widely cited as important.
And the degree of dominance of Palo Alto Weekly is very interesting.
Because so many voters had mail-in ballots,
there was a widespread belief that many of those voters would send in their ballots almost immediately,
and the campaigns and associated activities—forums, newspaper endorsements,…—needed
to compress their activities into late September and the first week of October.
However, the pattern of the survey respondents is representative of what actually occurred:
80% of the respondents used mail-in ballots, but over half voted on election day
and only 27% voted more than a week before the election.
We leave it to others to see if there are meaningful distinctions between these groups.
Contact by candidate supporters appears to be a significant negative,
especially when they cannot provide answers to questions about the candidate
and are judged an unwelcome interruption.
A very similar survey was conducted after the 2007 election
(Palo Alto Election Information Survey Report of Results as of November 13, 2007)
and was used as a starting point for this survey to allow comparisons between the results.
Notes on the design and publicizing of this survey, including comments on the relationship to the 2007 survey, have been split off into a separate document.
You can jump to the Summary Tables and Observations
if you don't want to read through the results for the individual questions first.
Notes on Presentation of Results
SurveyMonkey.com was used to conduct this survey
and almost all the presentations of the results were generated by their software.
The downloaded tabular data is identifiable by its gray background.
Because people have different preferences in charts,
a selection of formats were downloaded and made accessible via links below the tables for each questions.
Note: The charts do not include those who skipped the question. However, in this survey, this number is so small that it is unlikely to change what you take from the charts.
If you wish to do further analysis on the responses, you can download the responses as a CSV file
(XLS and XML formats are also available from the contact listed at the beginning of this document).
The cleanup of the data set missed two entries that should have been removed.
Response #308 (row 36, Respondent #909050538) was an incomplete version of #309 (it answered only Q1 and part of Q2);
response #341 (row 3, #916443649) answered only Q1.
Removing them decreases the counts of Mailed ballot before Sunday October 25
and Voted at the polls
by 1 each.
Aside: The download from SurveyMonkey did not include the introductory material and instructions—that has been manually added into the presentation (with a gray background).
A PDF of the Survey Form shows what the respondents saw,
except that the page breaks have been omitted.
Taking the survey using a hardcopy of this form was an option exercised by a single respondent.
Warning: Misleading Charts
For the questions ranking the information sources (Q3-Q9),
the preferred layout for people taking the survey
results in some of the charts produced (by SurveyMonkey.com)
being misleading.
We decided that it was far more important to have the layout favor those taking the survey,
especially since it would be relatively easy for someone who wants to present the data to redo the charts.
I regret that we did not have time to do this,
but should you produce such charts, we will gladly add them to this document.
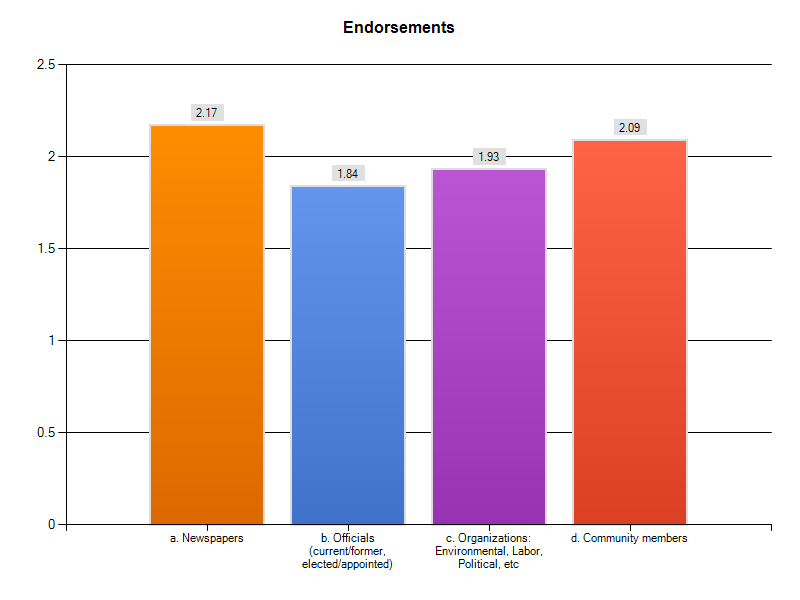
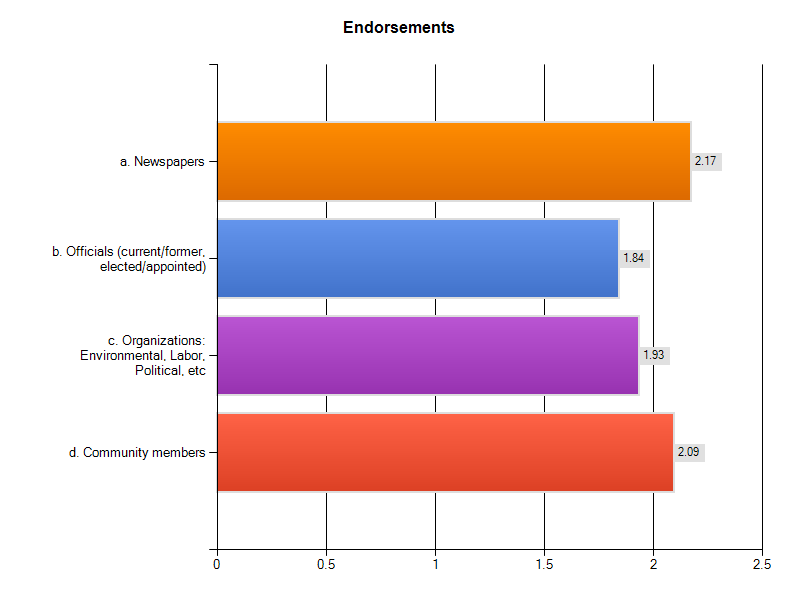
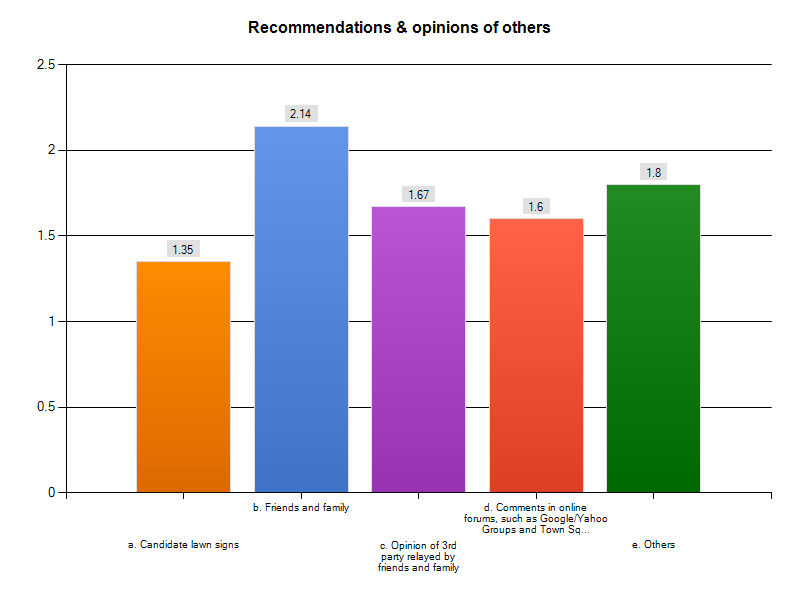
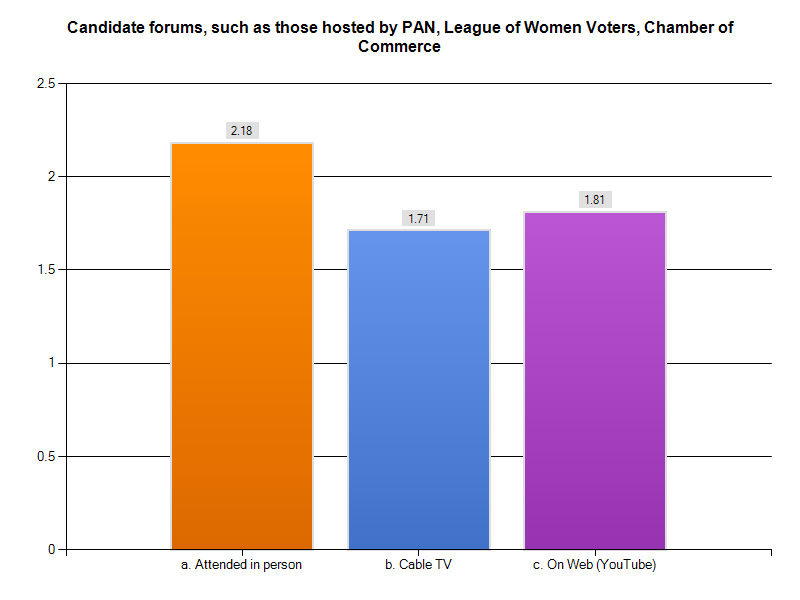
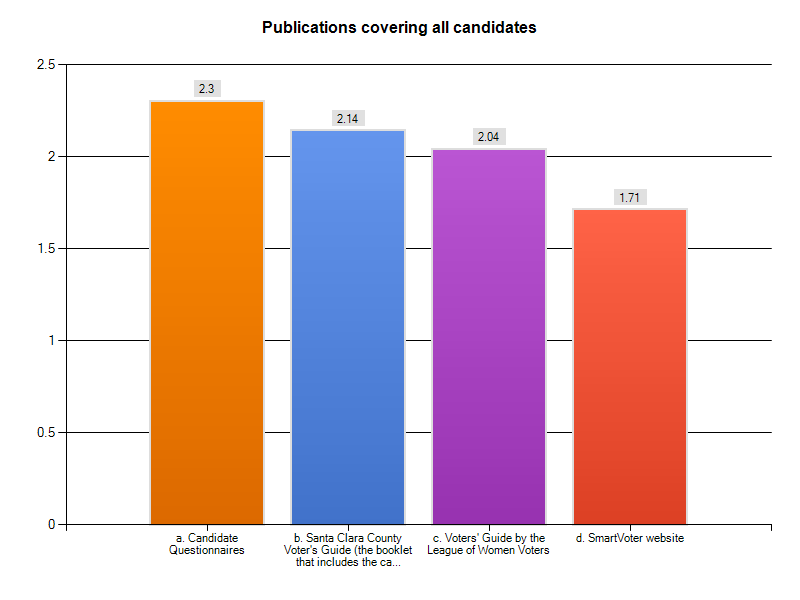
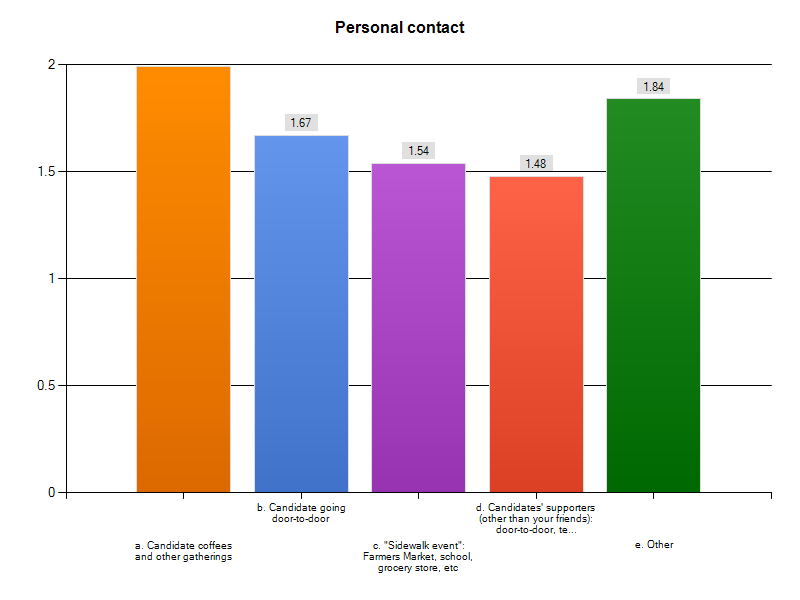
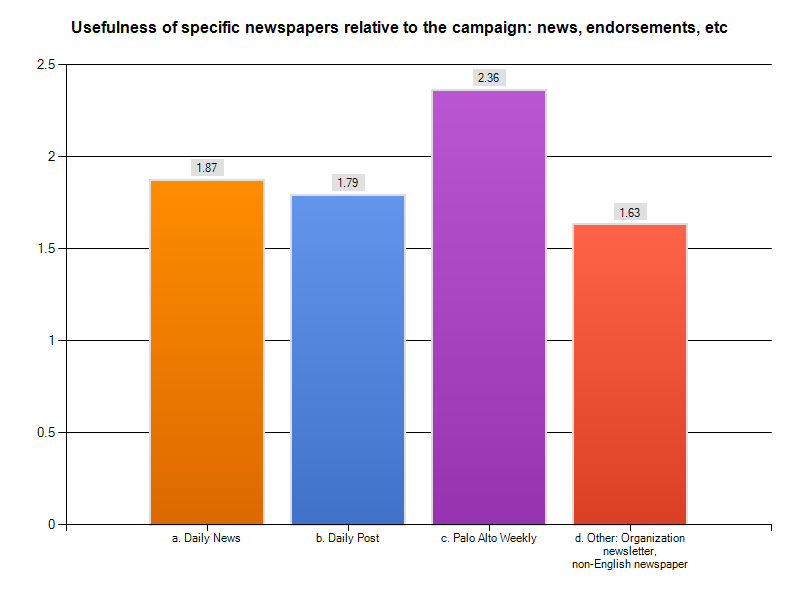
The first visualization problems are with the charts showing the average ratings:
The rating scale here is 1 to 3, but the axis on the charts start at zero,
visually diminishing the differences between the values for the different information sources.
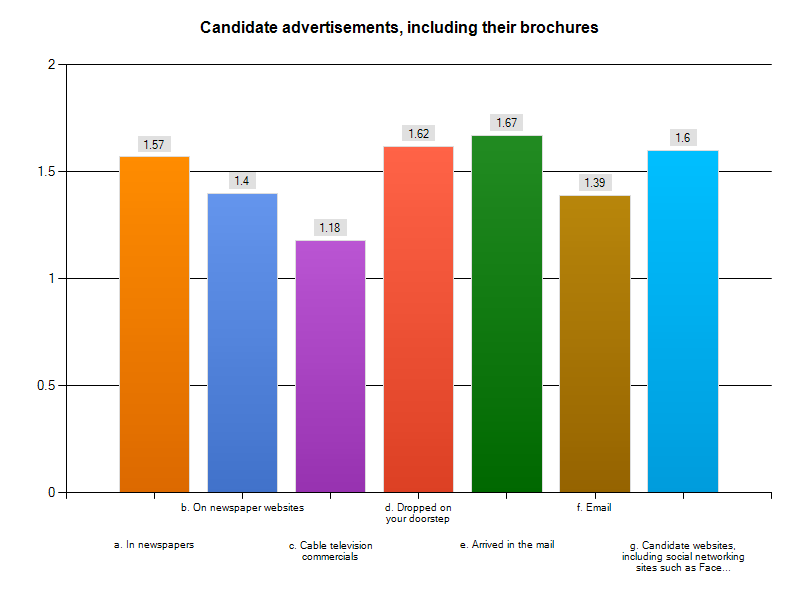
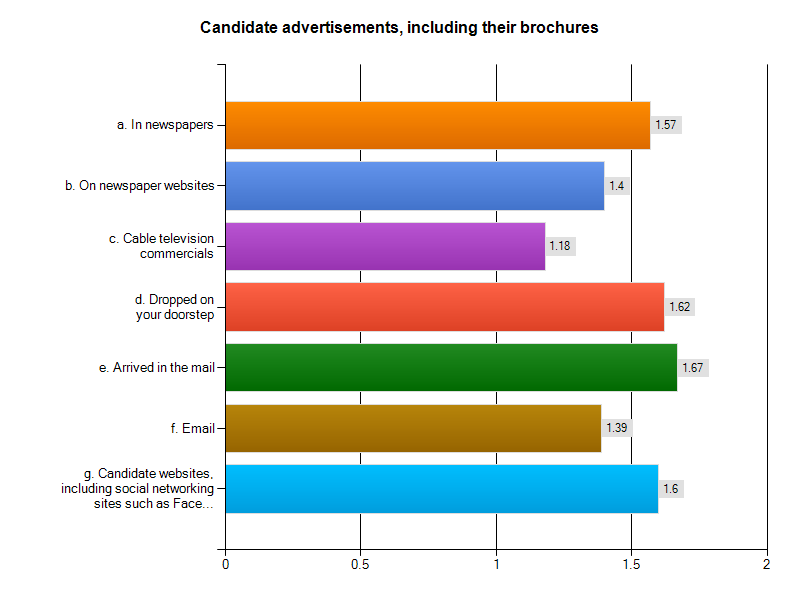
For example, in Q5's chart of average rankings,
ads on newspaper websites has an average rating of 1.4 and that for cable TV commercials is 1.18.
Visually, the former appears to be less than a fifth larger, when it should show as more being than double.
Note: This same problem can also occur if you are visualizing based upon the numbers from the results tables.
These charts also have a problem because the high end of the scale is omitted
if none of the averages are that large, thereby exaggerating the size of the average.
Continuing the above example (Q5 averages),
the largest average is 1.67, so the vertical axis on the chart stops at 2, rather than 3.
Thus, the bar for the average of 1.4 is visually 70% the height of the chart,
but corresponds to only 20% on the scale of 1 to 3.
Note that the averages do not include the N/A
responses
because although some N/A
responses belonged in the average, others didn't
(see the Design Notes for a brief discussion).
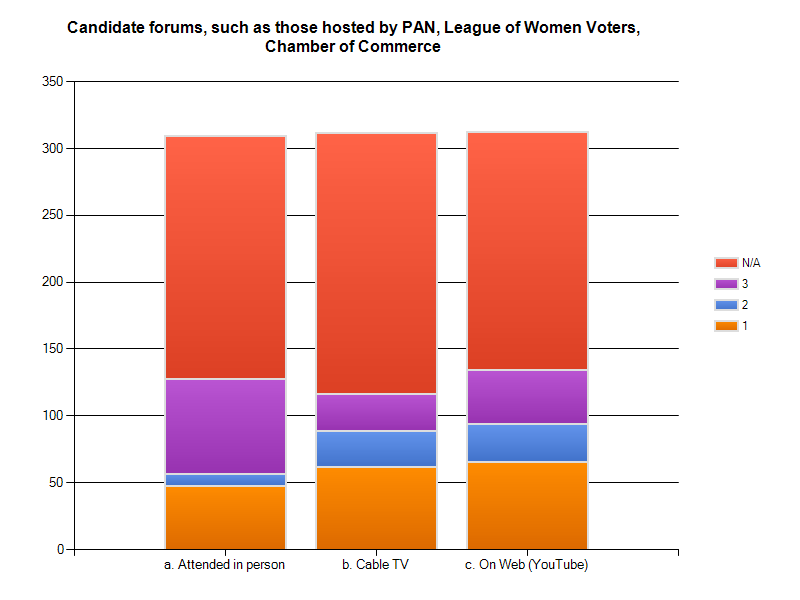
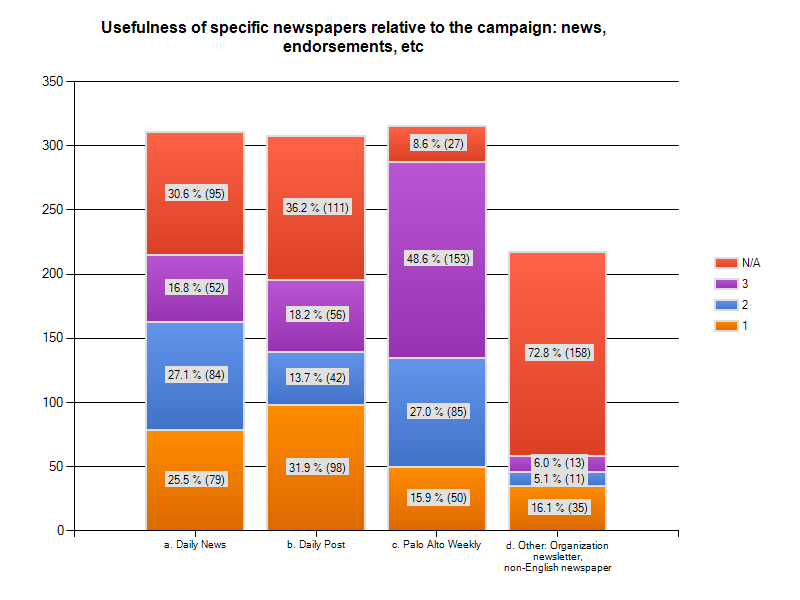
The second visualization problem is in stacked column and row charts,
which have a problem with where they display the N/A
counts.
Traditional survey physical layout has the N/A
as the last choice,
but when part of a 1-to-3 scale measuring usefulness with 1 being the lowest rating,
it is logically equivalent to a value of 0 and thus should be before/below 1,
instead of after/above 3.
NOTE: 2 invalid responses were discovered after the tables and charts were downloaded.
One was empty, the other was the beginning of a subsequent complete response and was only a fragment of a response to Q1.
Since this affected only the count of Skipped Question, it was not worth the effort of updating the tables and charts.
Survey Form Page 1
This is a survey about the information sources that voters used to decide which candidates to vote for for the Palo Alto City Council in 2009. Data about which sources voters consulted and how useful they found those sources can be used by candidates in future elections to better allocate their time and money to get better information to voters. The current high costs of campaigning are a serious deterrent for well-qualified people.
The SPONSOR of this survey is Palo Alto Neighborhoods (PAN), an umbrella group of neighborhood associations. During the campaign, PAN published the candidates' responses to a questionnaire covering a broad range of issues and conducted a Candidates Forum. The results of this survey will be compiled and placed online for PUBLIC use at our website www.PANeighborhoods.org
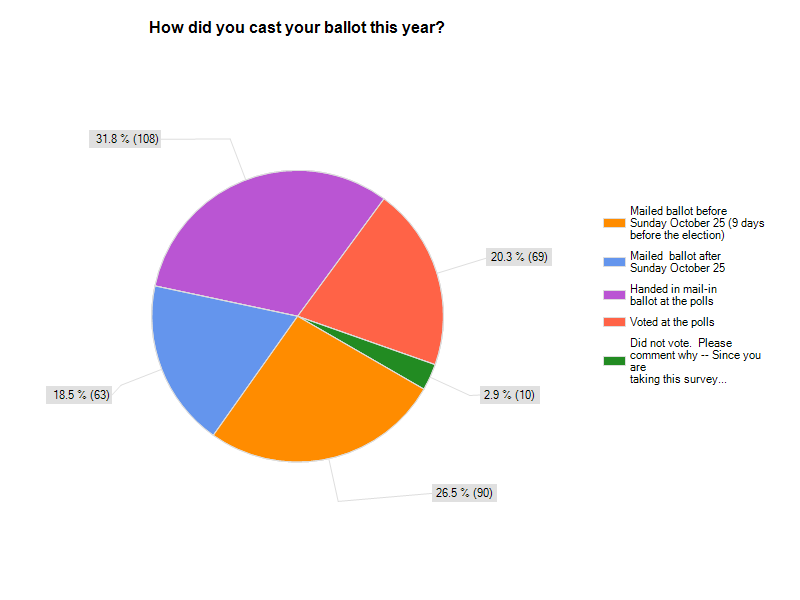
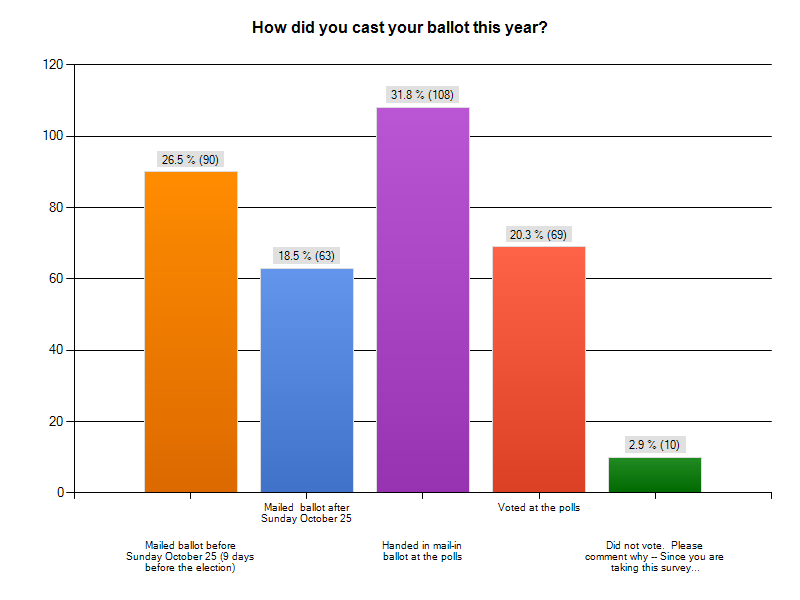
| 1. How did you cast your ballot this year? |
| |
answered question |
340 |
|
skipped question |
1 |
| |
Response
Percent |
Response
Count |
| Mailed ballot before Sunday October 25 (9 days before the election) |
|
26.5% |
90 |
| Mailed ballot after Sunday October 25 |
|
18.5% |
63 |
| Handed in mail-in ballot at the polls |
|
31.8% |
108 |
| Voted at the polls |
|
20.3% |
69 |
 viewDid not vote. Please comment why -- Since you are taking this survey, we presume you weren't uninterested. viewDid not vote. Please comment why -- Since you are taking this survey, we presume you weren't uninterested. |
|
2.9% |
10 |
Charts:
Pie,
Column,
Bar
Per question data: Textual summary
(PDF),
Spreadsheets: summary
(XLS)
and comments
(CSV)
Preliminary count:
82.3% of the ballots cast were Vote-by-Mail (VBM)
(source).
The final count from the County Registrar of Voters had 86% VBM:
36% of ballots were cast before Sunday October 25th;
30% were received by mail after Sunday October 25th;
20% were VBM ballots handed in at polling places on Election Day;
14% were votes at the polls.
Survey Form Page 2: Ranking the Information Sources
Please rate each of the below information sources in terms of how useful they were to YOU in THIS ELECTION. If you did not consult, or ignored, a source, mark the circle in the "N/A" column.
On this scale, use "1" for a source that was of little or no use in your deciding who to vote for, "2" for one that was moderately useful, and "3" for very useful.
You will have the opportunity to provide comments on these and other sources at the bottom of this web page.
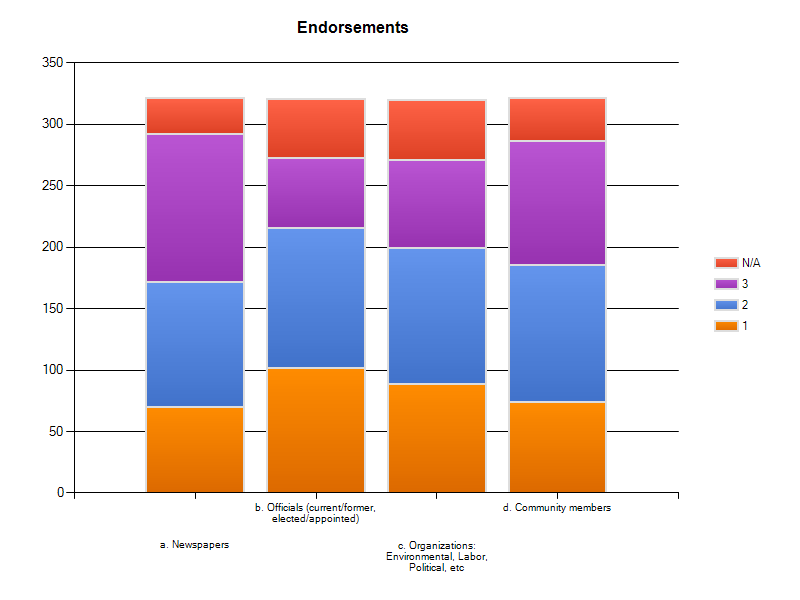
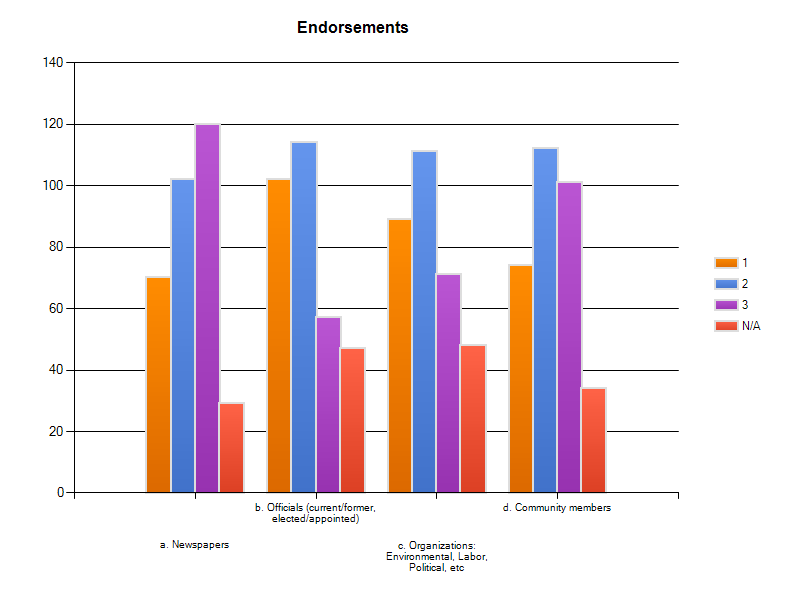
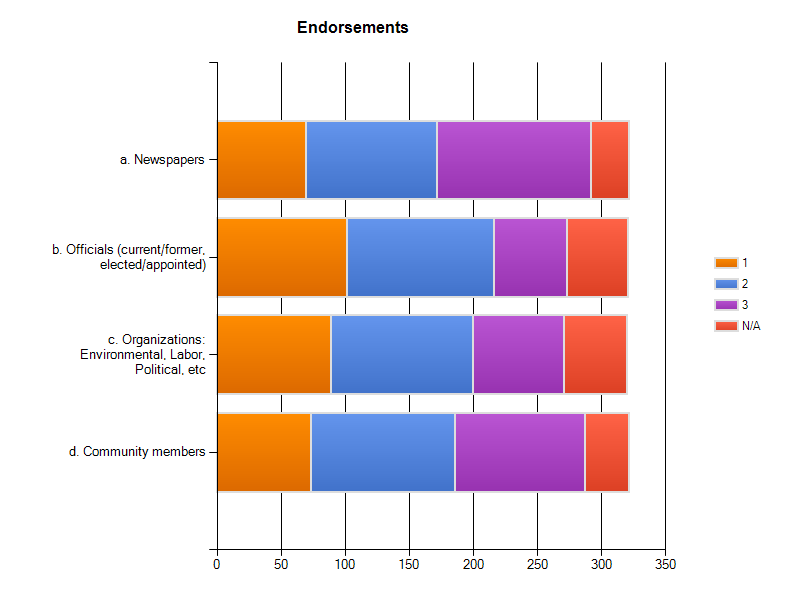
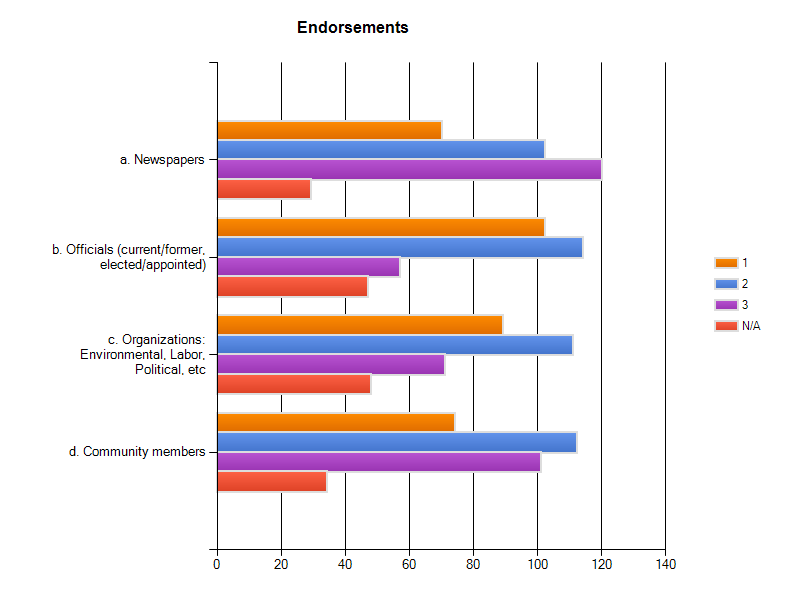
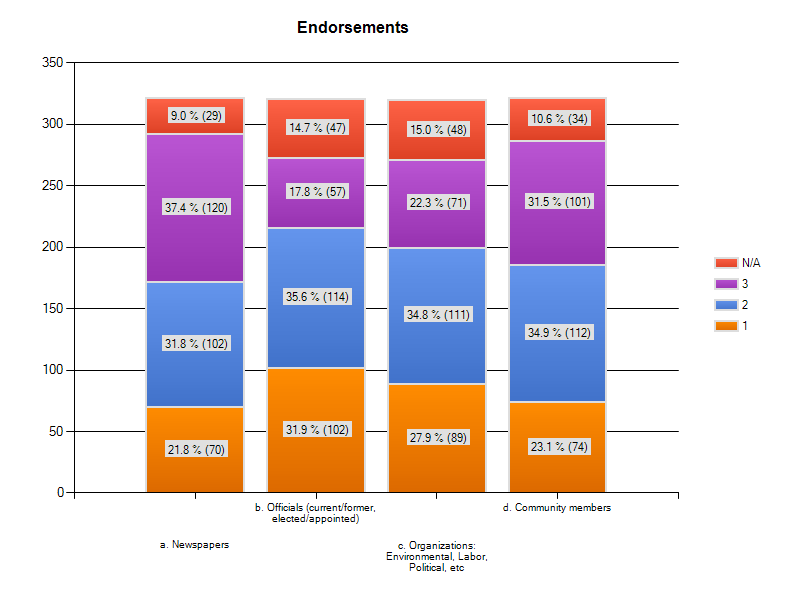
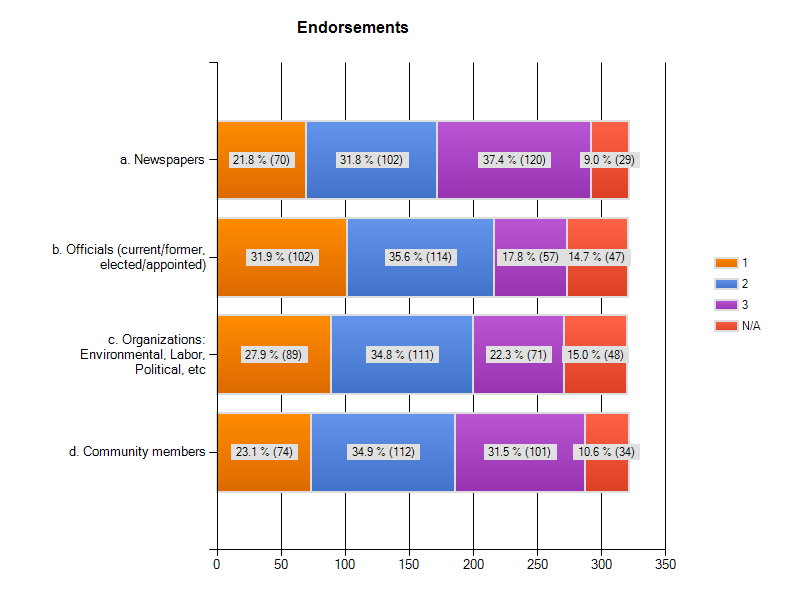
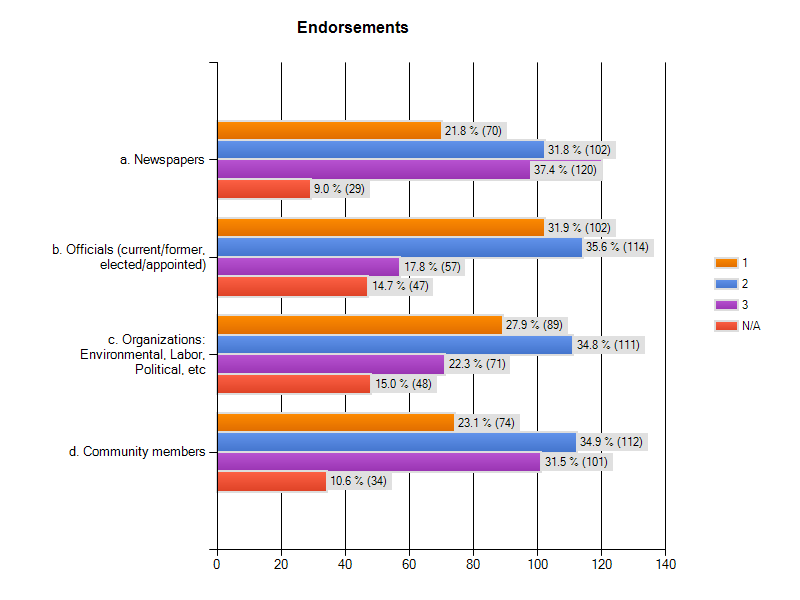
| 3. Endorsements |
| |
answered question |
322 |
|
skipped question |
19 |
| |
1 |
2 |
3 |
N/A |
Rating
Average |
Response
Count |
| a. Newspapers |
21.8% (70) |
31.8% (102) |
37.4% (120) |
9.0% (29) |
2.17 |
321 |
| b. Officials (current/former, elected/appointed) |
31.9% (102) |
35.6% (114) |
17.8% (57) |
14.7% (47) |
1.84 |
320 |
| c. Organizations: Environmental, Labor, Political, etc |
27.9% (89) |
34.8% (111) |
22.3% (71) |
15.0% (48) |
1.93 |
319 |
| d. Community members |
23.1% (74) |
34.9% (112) |
31.5% (101) |
10.6% (34) |
2.09 |
321 |
Charts:
Per question data: Textual summary
(PDF),
Spreadsheet
(XLS)
Newspaper Endorsements and Candidate Vote Totals
Candidate
Votes (as of 11/6) |
Klein
7723 |
Holman
7579 |
Price
7441 |
Shepherd
6367 |
Scharff
5855 |
Leong
4937 |
Dykwel
4353 |
Levens
3666 |
Hackmann
3636 |
Steen
2973 |
Gray
2098 |
Gaither
1281 |
Weiss
720 |
Frost
456 |
| PA Weekly |
x |
x |
x |
x |
x |
|
|
|
|
|
|
|
|
|
| Daily News |
x |
|
x |
|
|
x |
x |
x |
|
|
|
|
|
|
| Daily Post |
x |
x |
|
|
x |
x |
|
|
x |
|
|
|
|
|
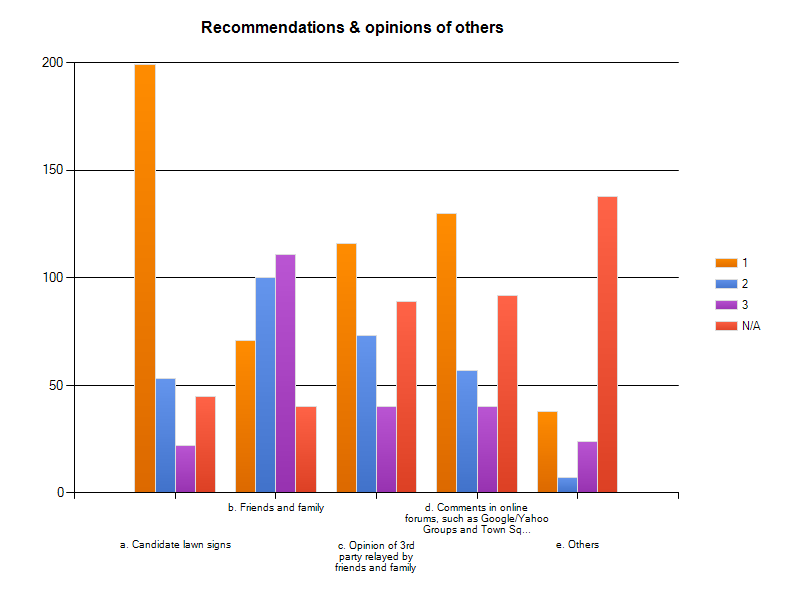
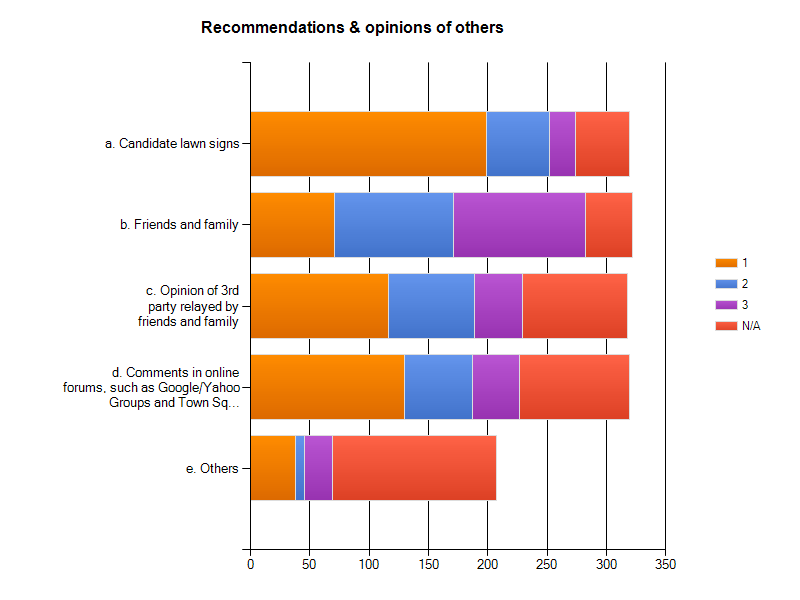
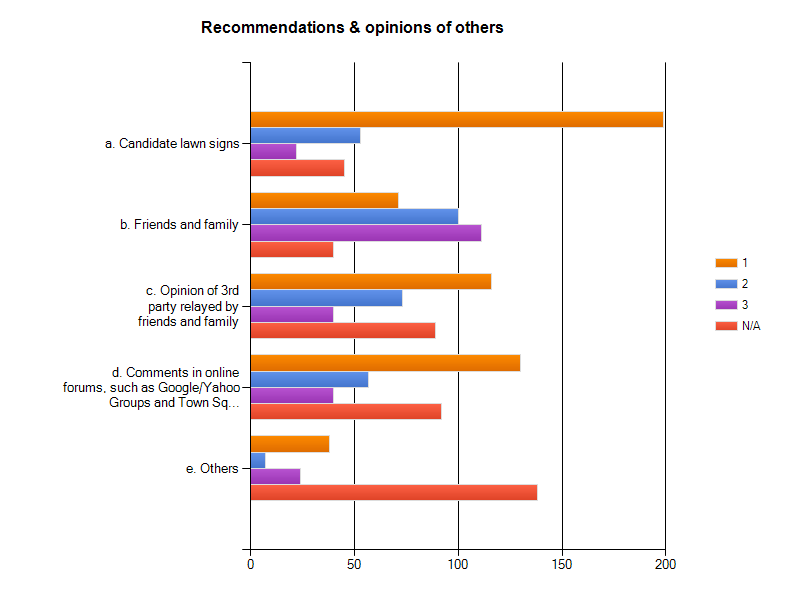
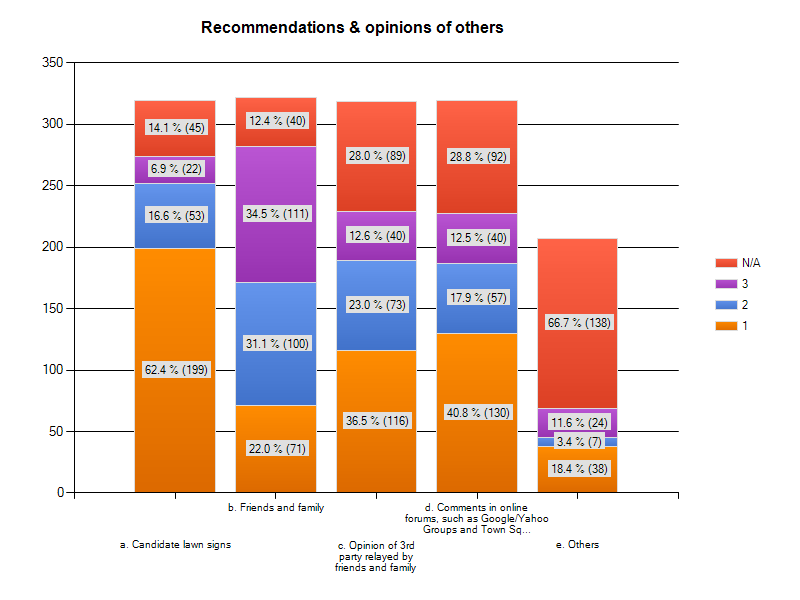
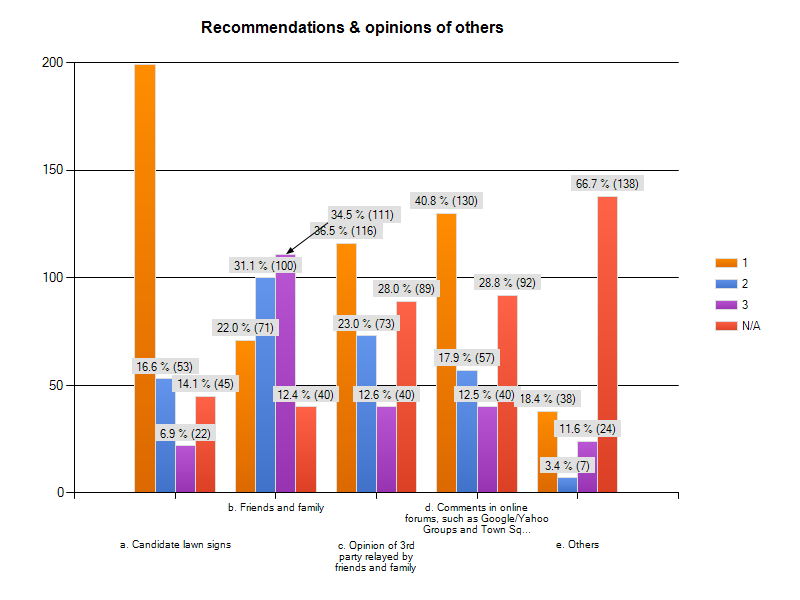
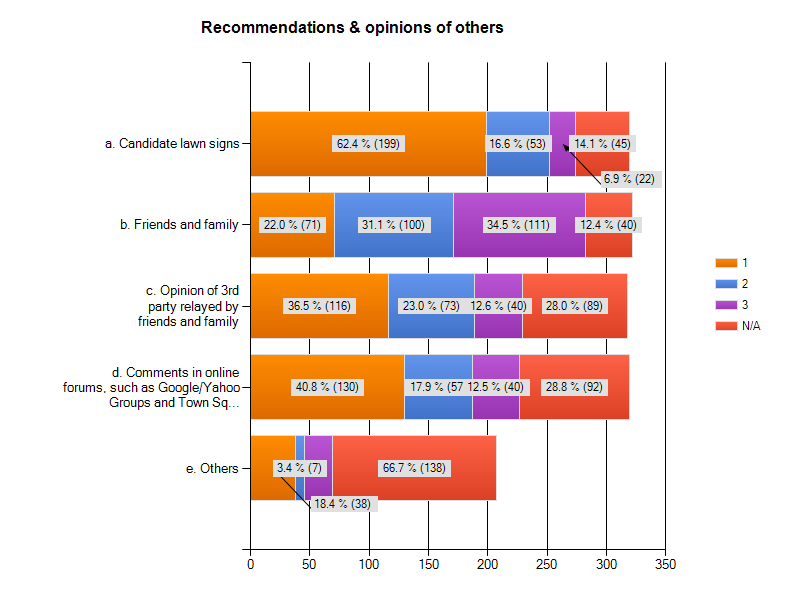
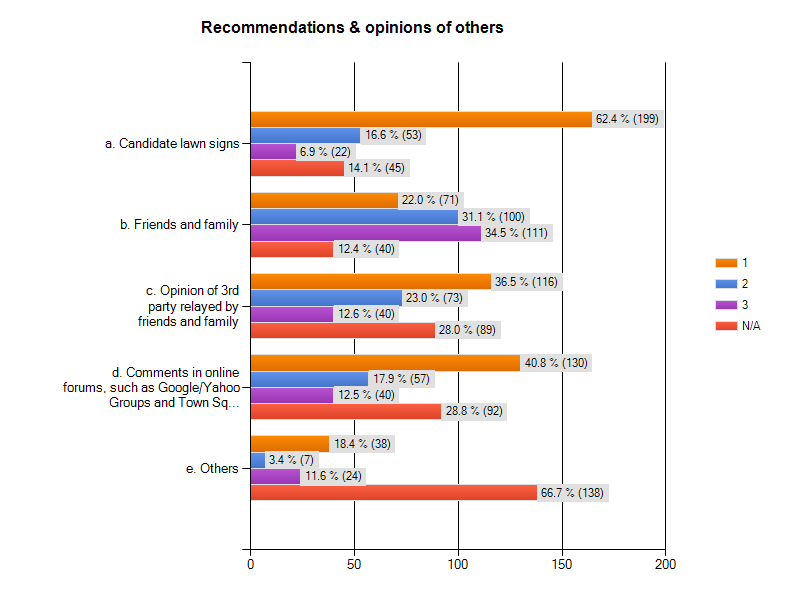
| 4. Recommendations & opinions of others |
| |
answered question |
322 |
|
skipped question |
19 |
| |
1 |
2 |
3 |
N/A |
Rating
Average |
Response
Count |
| a. Candidate lawn signs |
62.4% (199) |
16.6% (53) |
6.9% (22) |
14.1% (45) |
1.35 |
319 |
| b. Friends and family |
22.0% (71) |
31.1% (100) |
34.5% (111) |
12.4% (40) |
2.14 |
322 |
| c. Opinion of 3rd party relayed by friends and family |
36.5% (116) |
23.0% (73) |
12.6% (40) |
28.0% (89) |
1.67 |
318 |
| d. Comments in online forums, such as Google/Yahoo Groups and Town Square Forum |
40.8% (130) |
17.9% (57) |
12.5% (40) |
28.8% (92) |
1.60 |
319 |
| e. Others |
18.4% (38) |
3.4% (7) |
11.6% (24) |
66.7% (138) |
1.80 |
207 |
| viewIf "Others", please describe |
40 |
Charts:
Per question data: Textual summary
(PDF),
Spreadsheets: summary
(XLS)
and Others
(CSV)
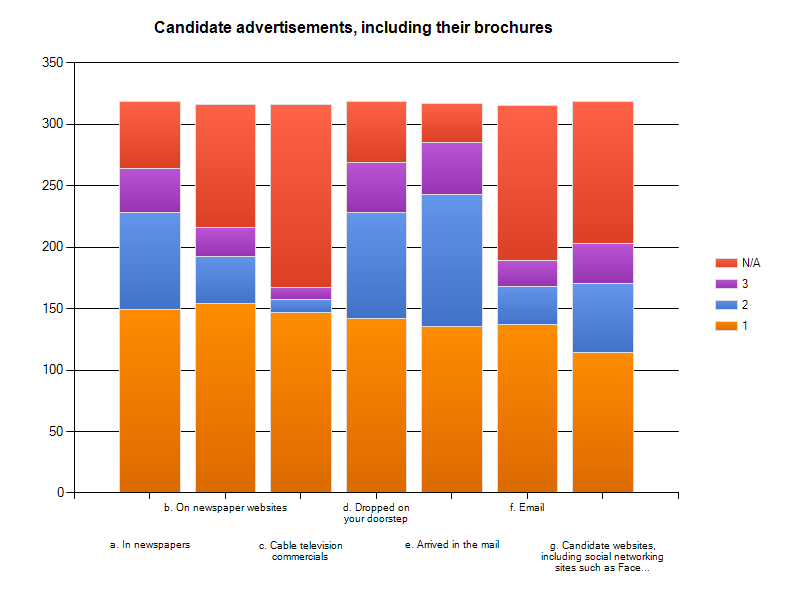
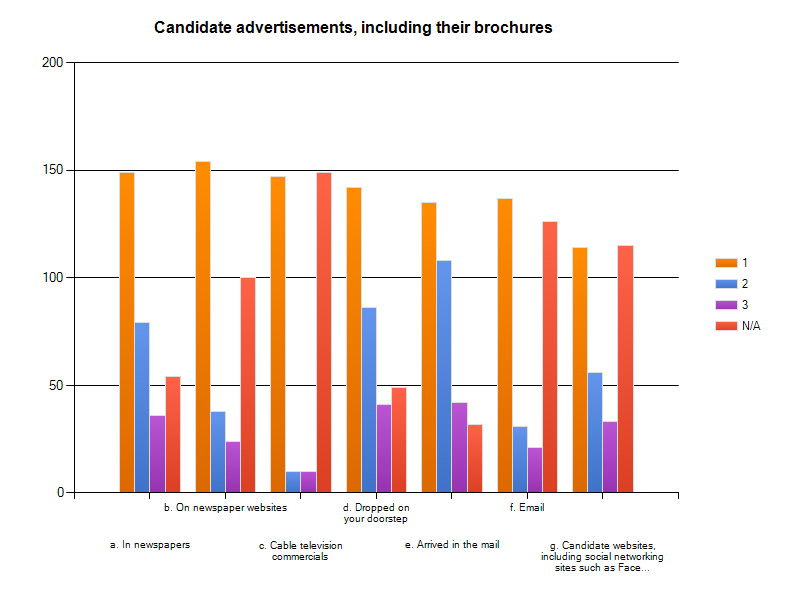
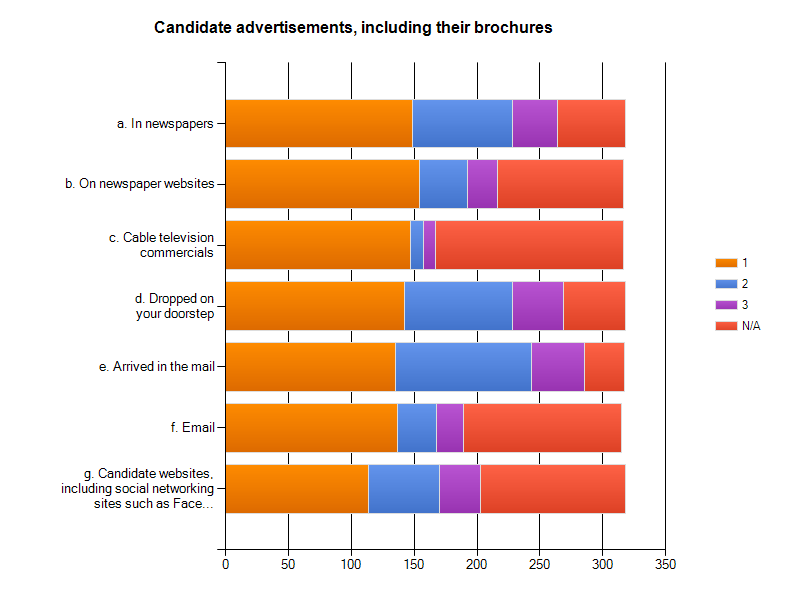
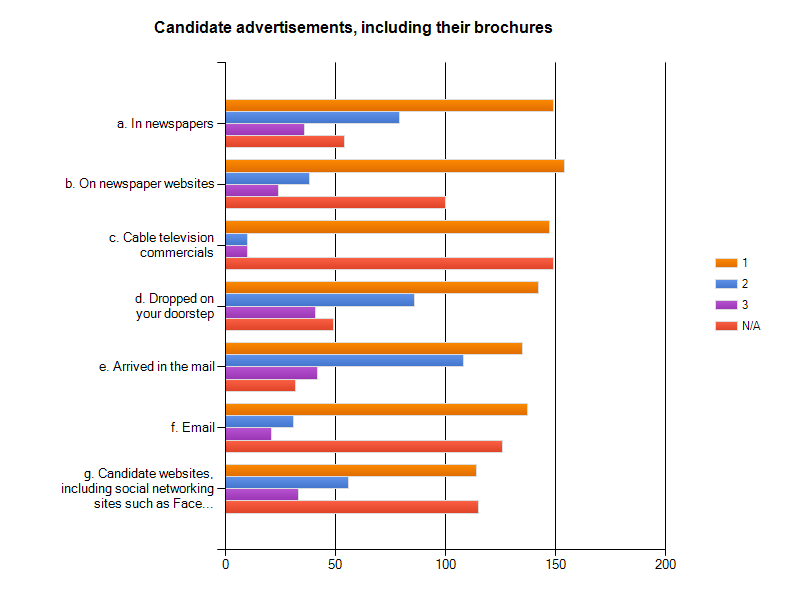
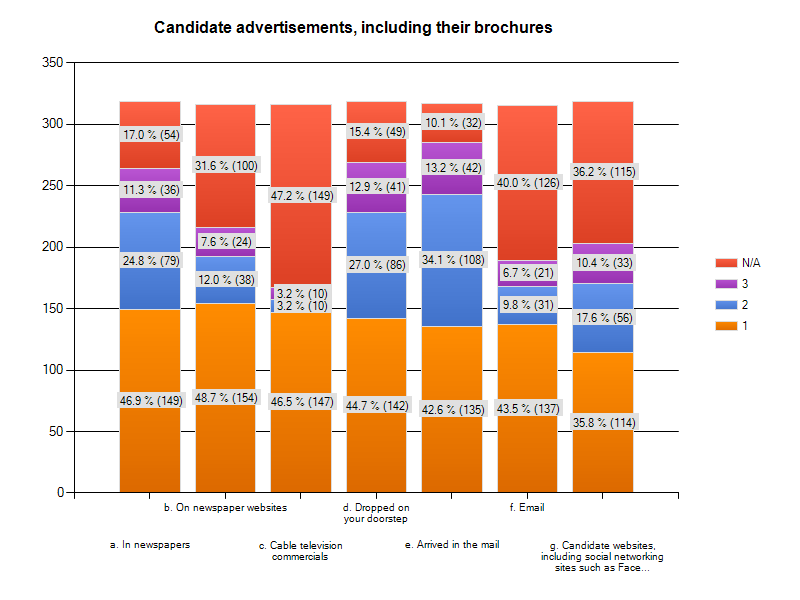
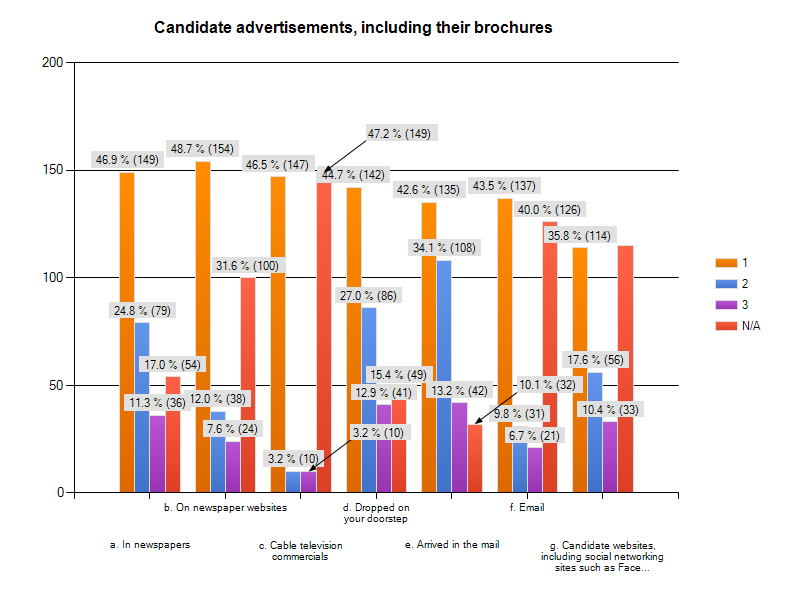
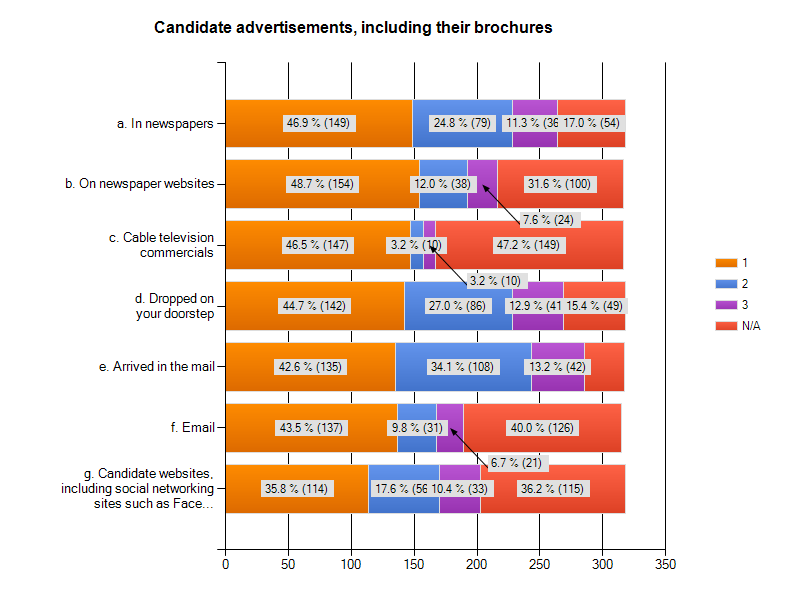
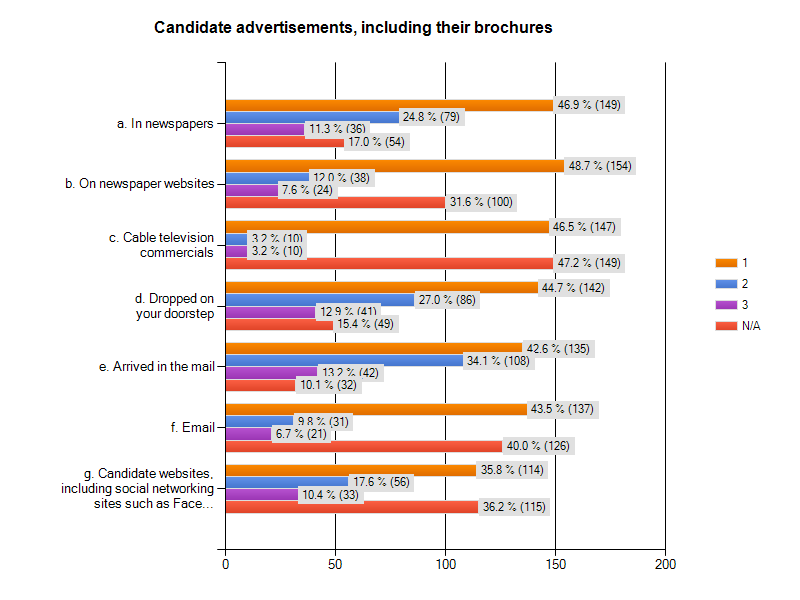
| 5. Candidate advertisements, including their brochures |
| |
answered question |
321 |
|
skipped question |
20 |
| |
1 |
2 |
3 |
N/A |
Rating
Average |
Response
Count |
| a. In newspapers |
46.9% (149) |
24.8% (79) |
11.3% (36) |
17.0% (54) |
1.57 |
318 |
| b. On newspaper websites |
48.7% (154) |
12.0% (38) |
7.6% (24) |
31.6% (100) |
1.40 |
316 |
| c. Cable television commercials |
46.5% (147) |
3.2% (10) |
3.2% (10) |
47.2% (149) |
1.18 |
316 |
| d. Dropped on your doorstep |
44.7% (142) |
27.0% (86) |
12.9% (41) |
15.4% (49) |
1.62 |
318 |
| e. Arrived in the mail |
42.6% (135) |
34.1% (108) |
13.2% (42) |
10.1% (32) |
1.67 |
317 |
| f. Email |
43.5% (137) |
9.8% (31) |
6.7% (21) |
40.0% (126) |
1.39 |
315 |
| g. Candidate websites, including social networking sites such as Facebook |
35.8% (114) |
17.6% (56) |
10.4% (33) |
36.2% (115) |
1.60 |
318 |
Charts:
Per question data: Textual summary
(PDF),
Spreadsheet
(XLS)
Additional information:
Only one candidate, Richard Hackmann, is known to have run cable TV commercials.
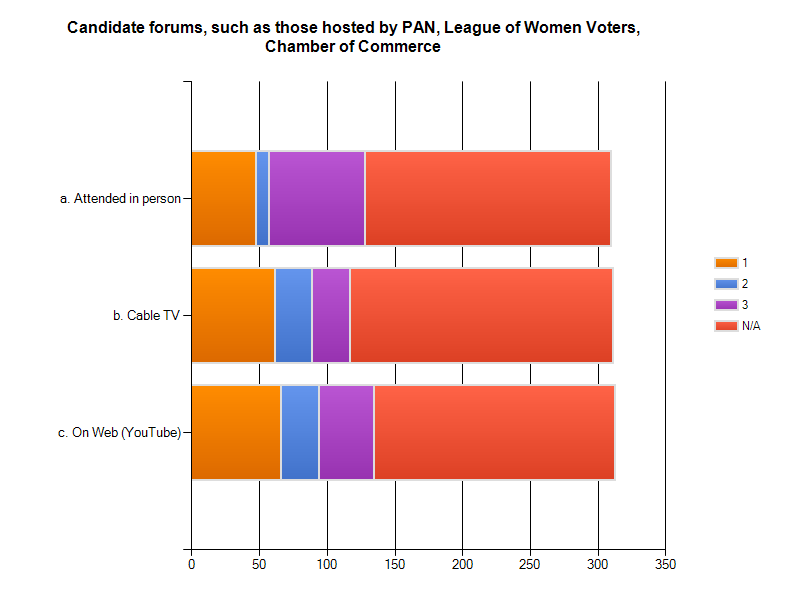
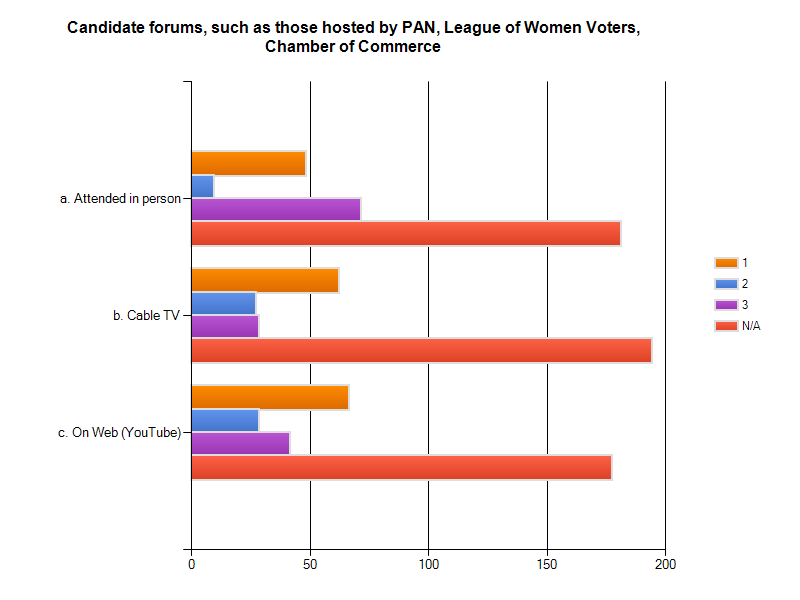
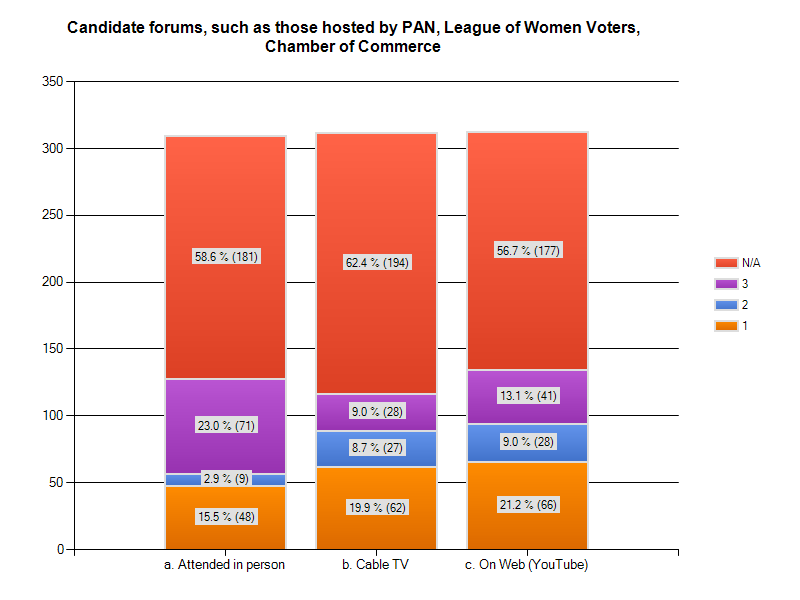
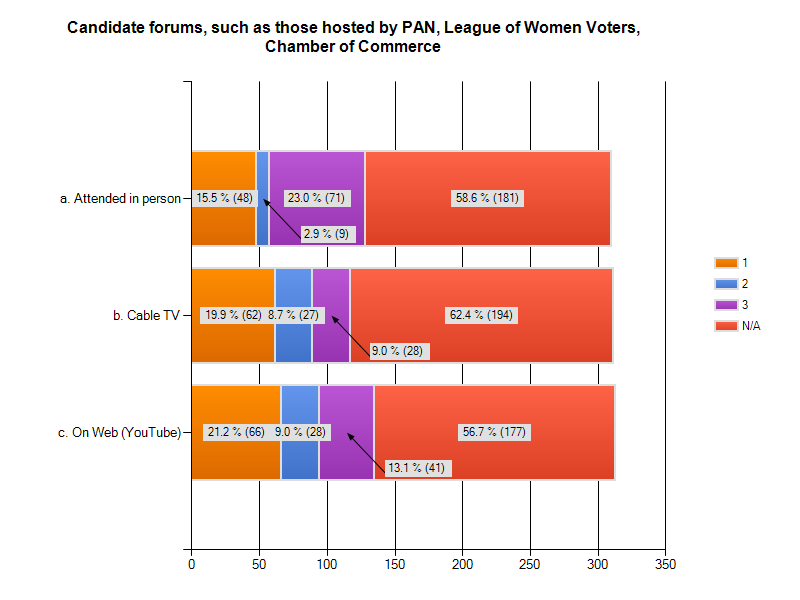
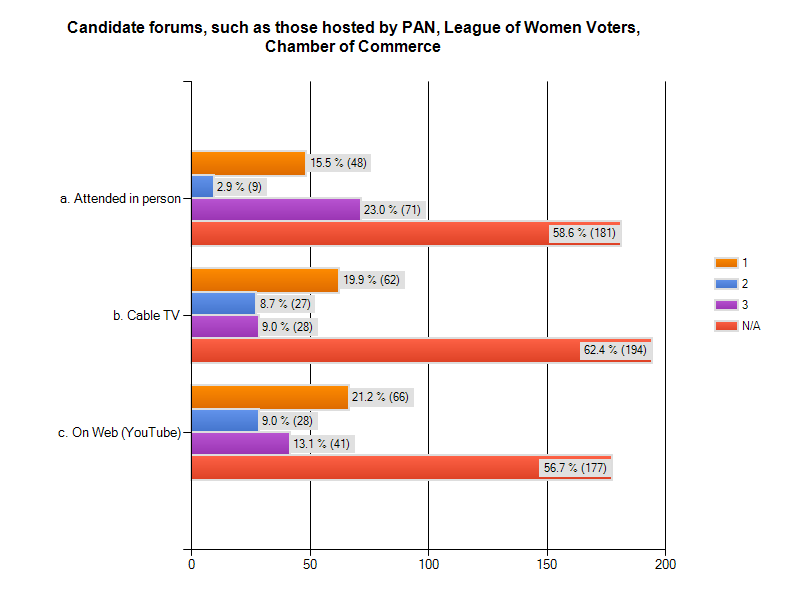
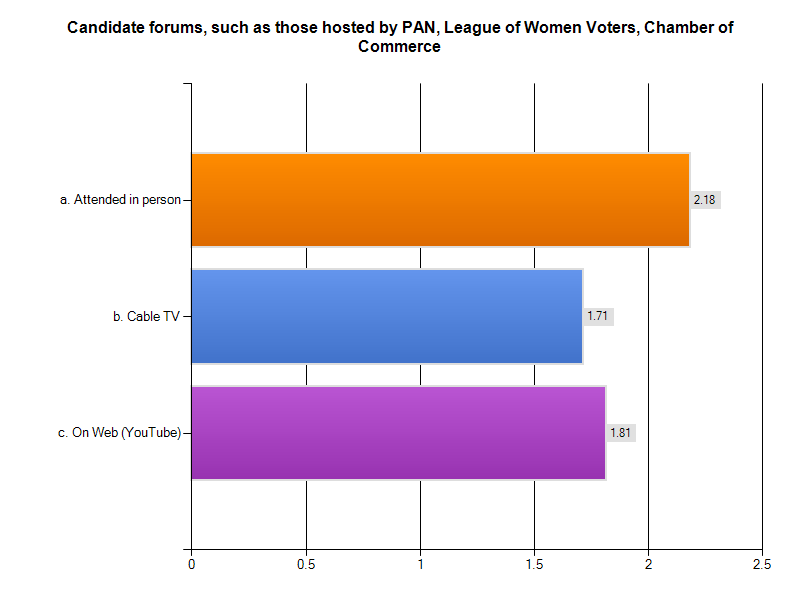
| 6. Candidate forums, such as those hosted by PAN, League of Women Voters, Chamber of Commerce |
| |
answered question |
317 |
|
skipped question |
24 |
| |
1 |
2 |
3 |
N/A |
Rating
Average |
Response
Count |
| a. Attended in person |
15.5% (48) |
2.9% (9) |
23.0% (71) |
58.6% (181) |
2.18 |
309 |
| b. Cable TV |
19.9% (62) |
8.7% (27) |
9.0% (28) |
62.4% (194) |
1.71 |
311 |
| c. On Web (YouTube) |
21.2% (66) |
9.0% (28) |
13.1% (41) |
56.7% (177) |
1.81 |
312 |
Charts:
Per question data: Textual summary
(PDF),
Spreadsheet
(XLS)
Additional information:
There were four candidates forums:
September 24 sponsored by the Chamber of Commerce,
October 6 and October 10 sponsored by the League of Women Voters,
October 7 sponsored by Palo Alto Neighborhoods.
The Media Center (successor to Cable Co-op) recorded the last two
and rebroadcast them on a Community Access cable channel
and made them available for web viewing on their YouTube channel.
The first forum (9/24, Chamber) was not mentioned in Q2,
but this is not surprising because it was attended mostly by insiders
—it was before most voters had started paying attention, it started at 5:30pm, …
The League of Women Voters reports
about 200 people attended the League's 2 City Council Candidates Forums and about 600 viewers watched the on-line videos of the 2nd Forum on the Media Center Elections web site.
The PAN Forum was attended by about 133 people.
The online videos of the first and second hours had 214 and 93 views respectively.
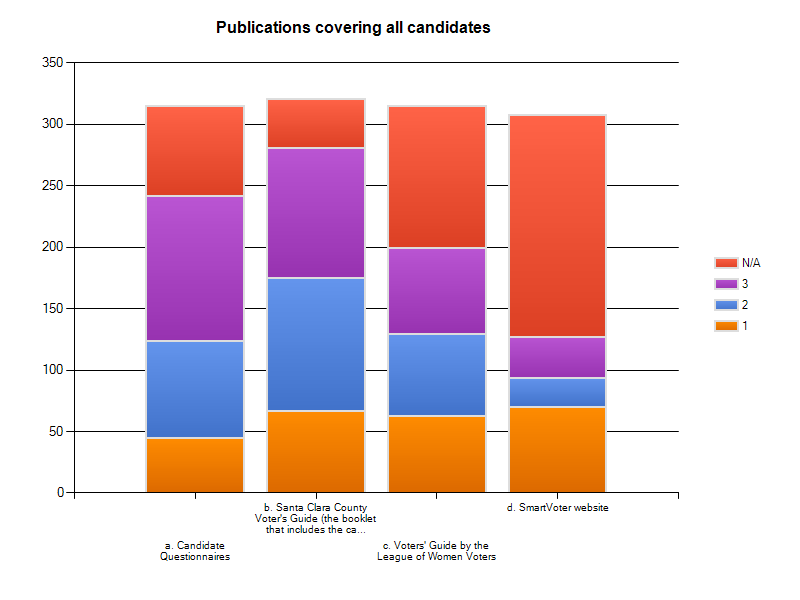
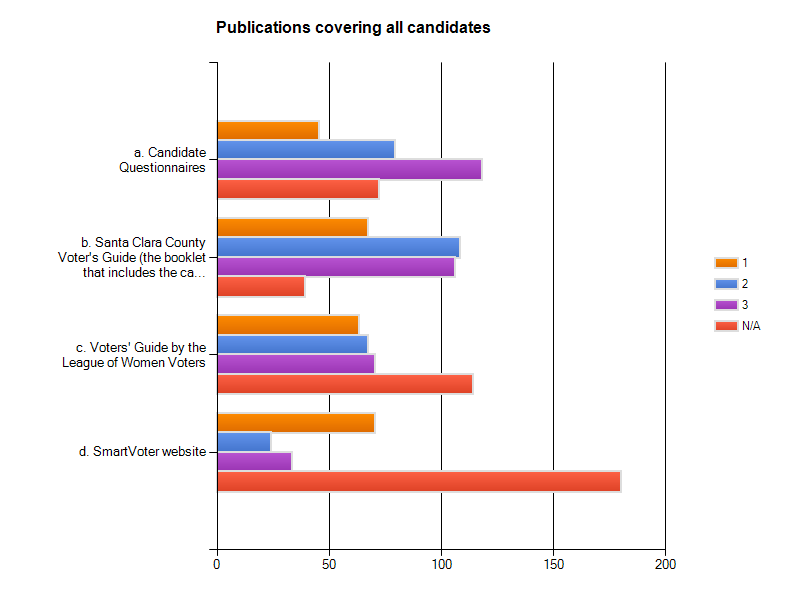
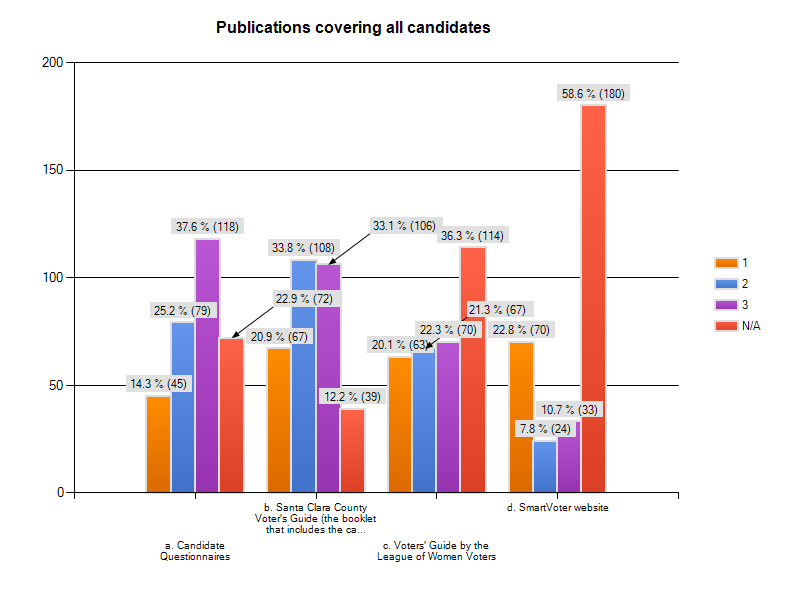
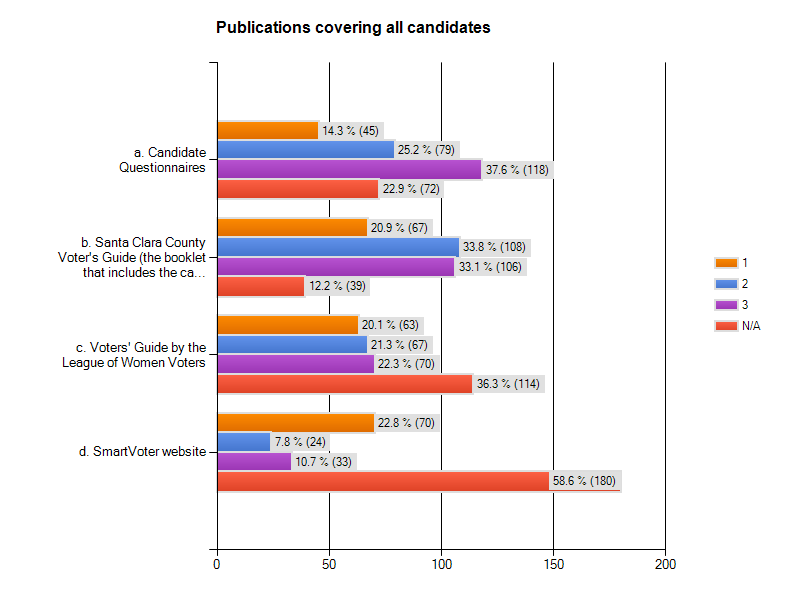
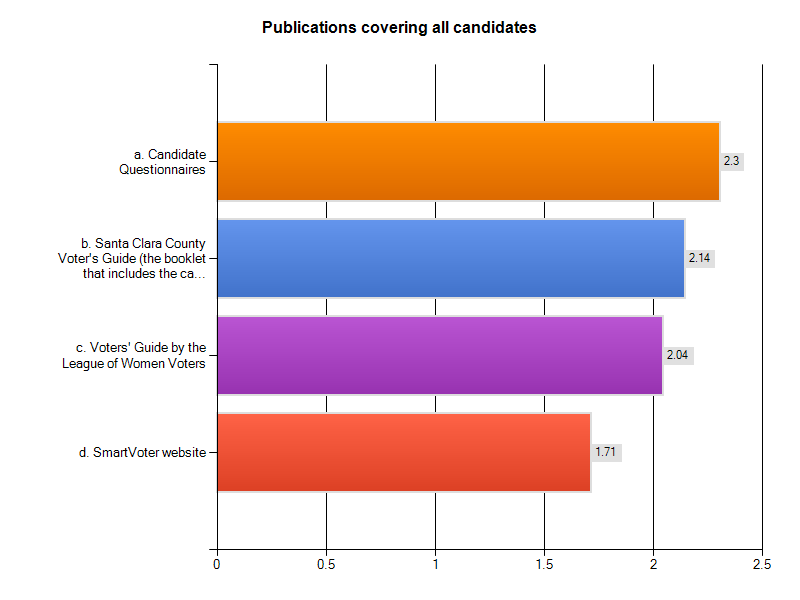
| 7. Publications covering all candidates |
| |
answered question |
321 |
|
skipped question |
20 |
| |
1 |
2 |
3 |
N/A |
Rating
Average |
Response
Count |
| a. Candidate Questionnaires |
14.3% (45) |
25.2% (79) |
37.6% (118) |
22.9% (72) |
2.30 |
314 |
| b. Santa Clara County Voter's Guide (the booklet that includes the candidates' ballot statements) |
20.9% (67) |
33.8% (108) |
33.1% (106) |
12.2% (39) |
2.14 |
320 |
| c. Voters' Guide by the League of Women Voters |
20.1% (63) |
21.3% (67) |
22.3% (70) |
36.3% (114) |
2.04 |
314 |
| d. SmartVoter website |
22.8% (70) |
7.8% (24) |
10.7% (33) |
58.6% (180) |
1.71 |
307 |
Charts:
Per question data: Textual summary
(PDF),
Spreadsheet
(XLS)
Additional information:
The League of Women Voters reports:
(1) About 1500 copies of our printed Voters Guide were distributed to libraries, public locations and members of the community
and (2)
All pages about the candidates for the Palo Alto City Council race and Measure A on the League's Smart Voter web site were viewed 5,850 times from the time period of Monday, October 5 through Wednesday, November 4.
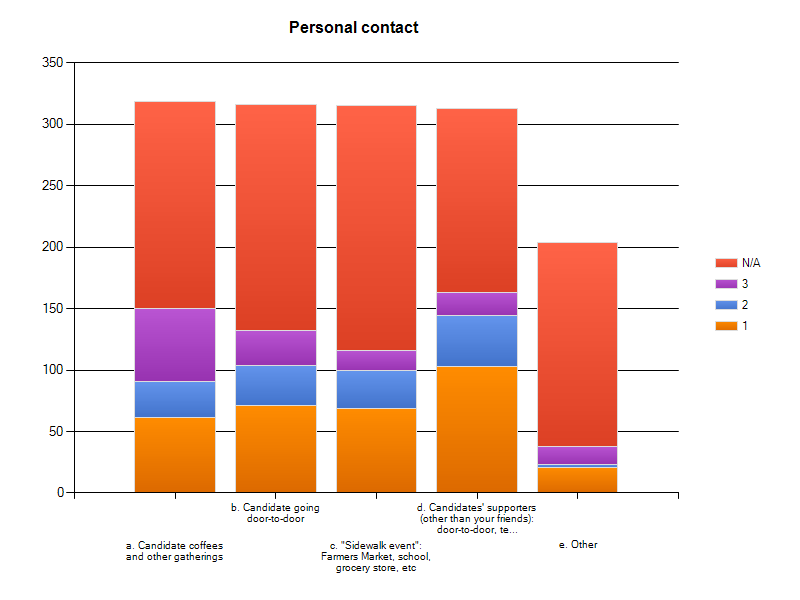
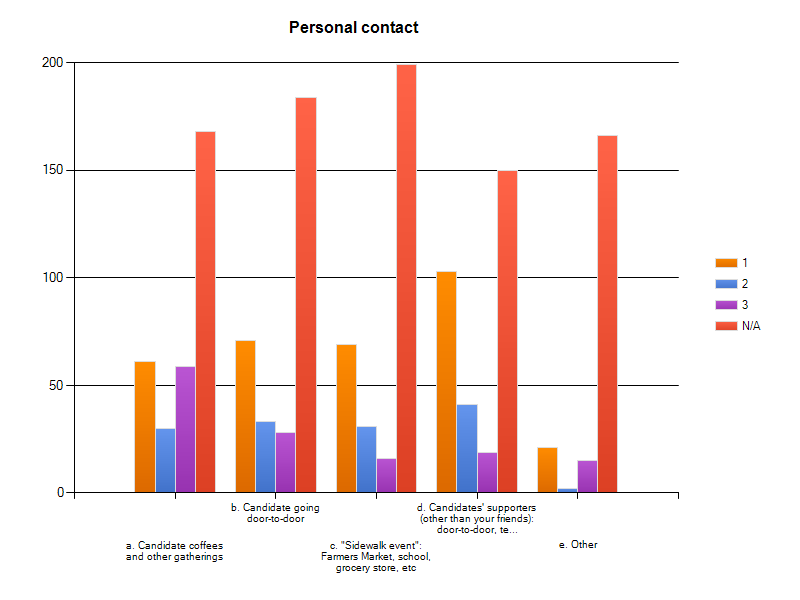
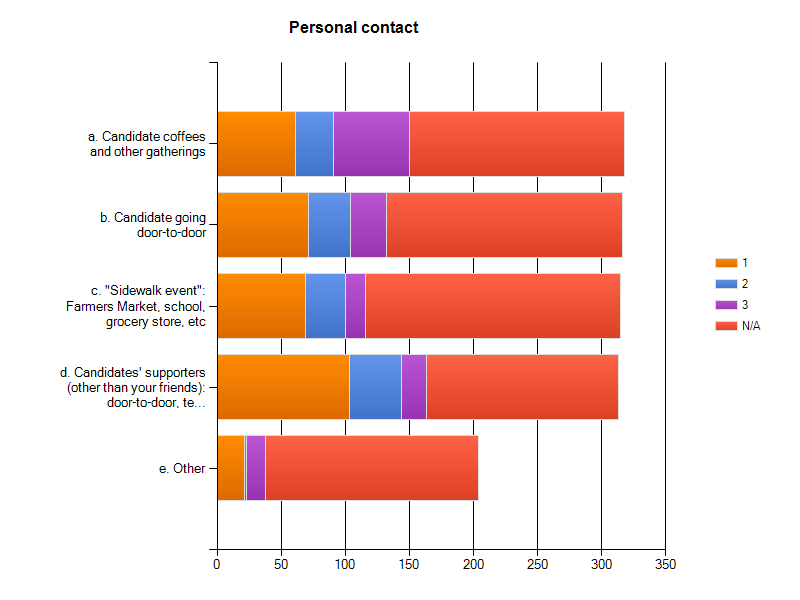
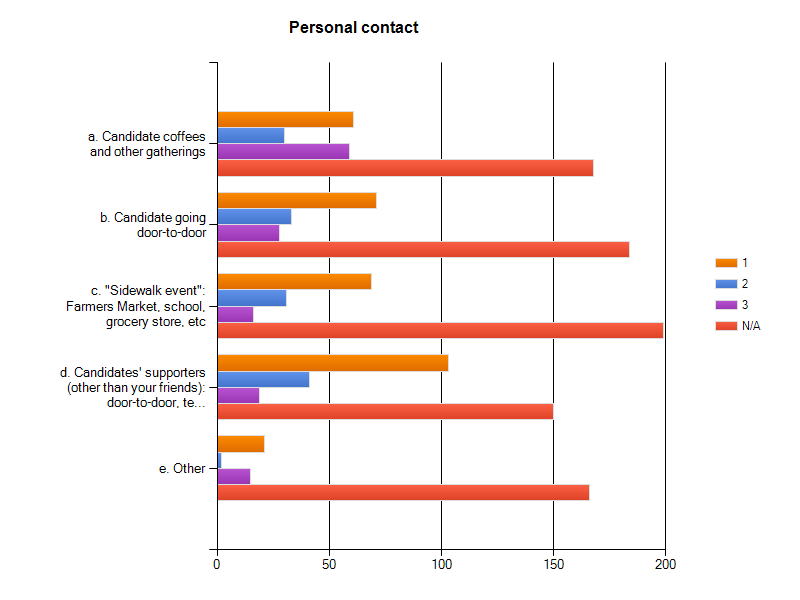
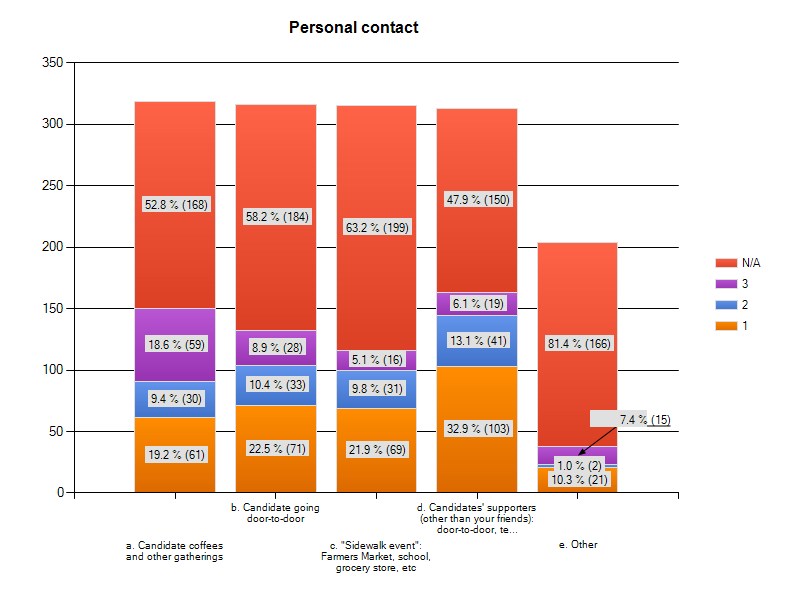
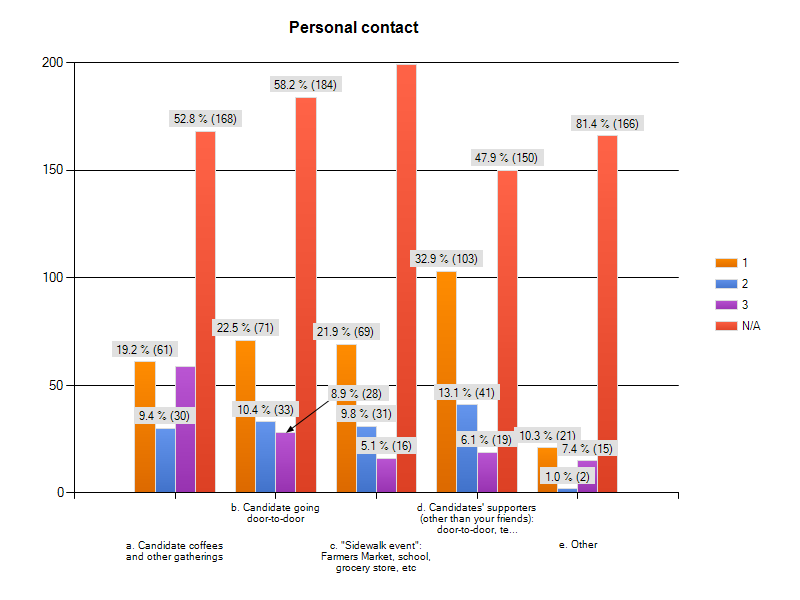
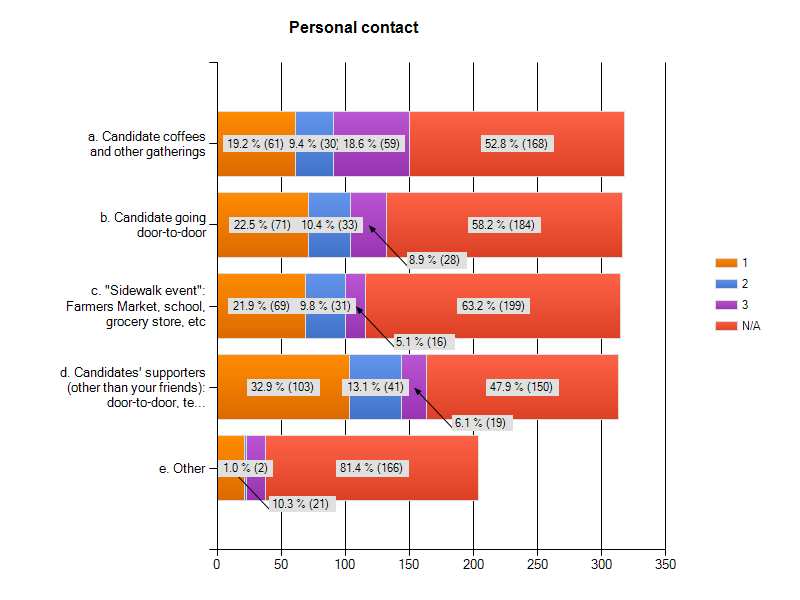
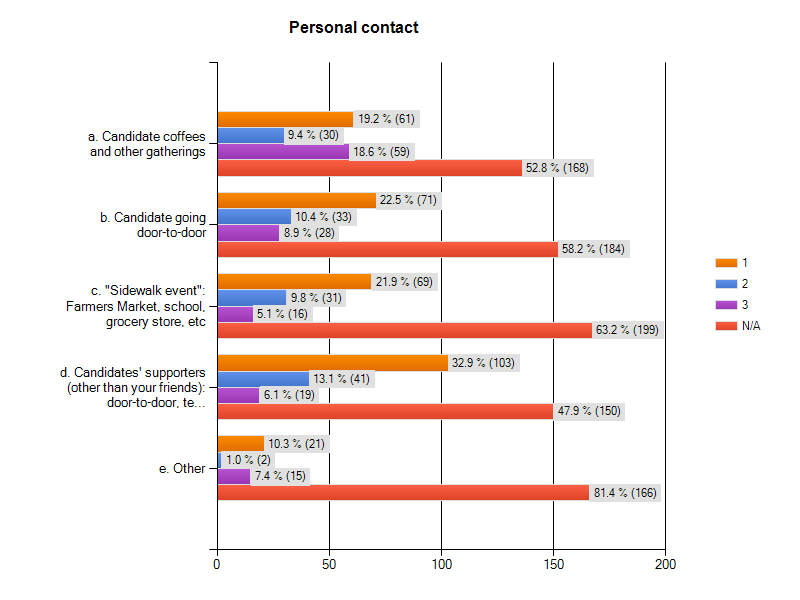
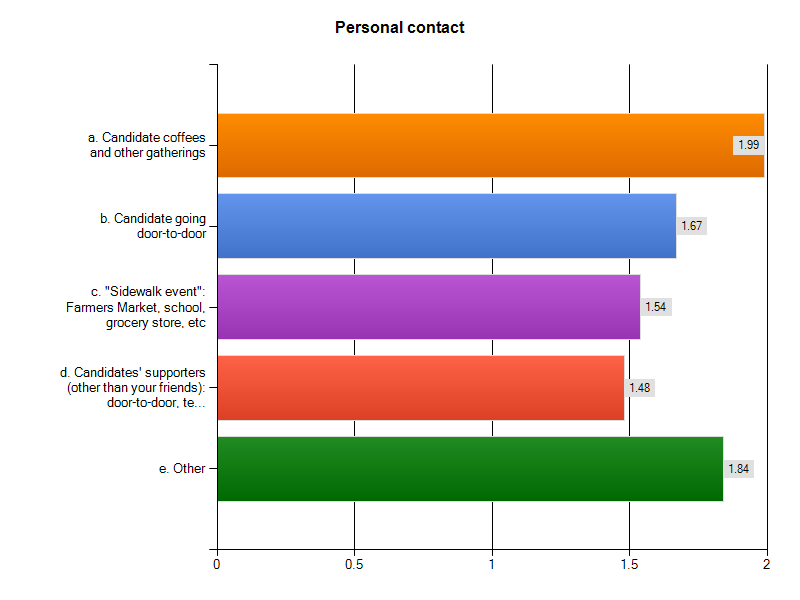
| 8. Personal contact |
| |
answered question |
318 |
|
skipped question |
23 |
| |
1 |
2 |
3 |
N/A |
Rating
Average |
Response
Count |
| a. Candidate coffees and other gatherings |
19.2% (61) |
9.4% (30) |
18.6% (59) |
52.8% (168) |
1.99 |
318 |
| b. Candidate going door-to-door |
22.5% (71) |
10.4% (33) |
8.9% (28) |
58.2% (184) |
1.67 |
316 |
| c. "Sidewalk event": Farmers Market, school, grocery store, etc |
21.9% (69) |
9.8% (31) |
5.1% (16) |
63.2% (199) |
1.54 |
315 |
| d. Candidates' supporters (other than your friends): door-to-door, telephone, etc |
32.9% (103) |
13.1% (41) |
6.1% (19) |
47.9% (150) |
1.48 |
313 |
| e. Other |
10.3% (21) |
1.0% (2) |
7.4% (15) |
81.4% (166) |
1.84 |
204 |
| viewIf "Other", please specify |
21 |
Charts:
Per question data: Textual summary
(PDF),
Spreadsheets: summary
(XLS)
and Other
(CSV)
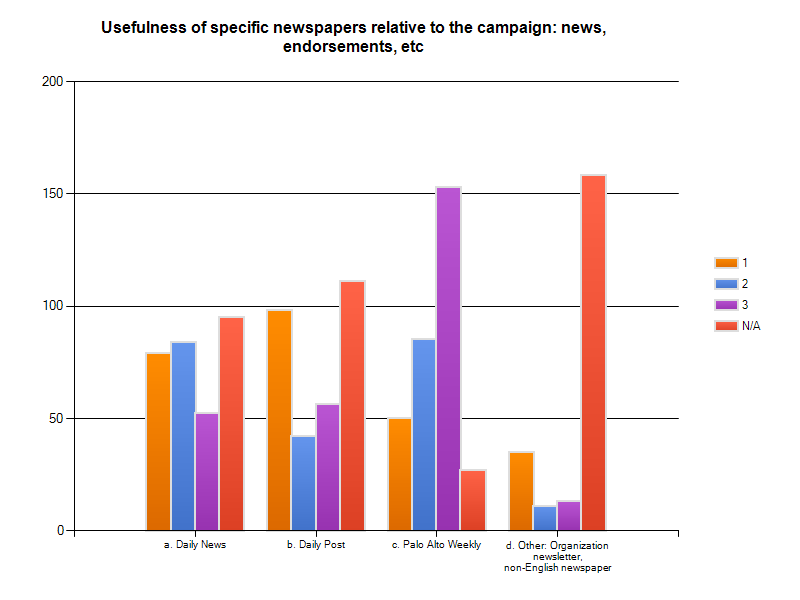
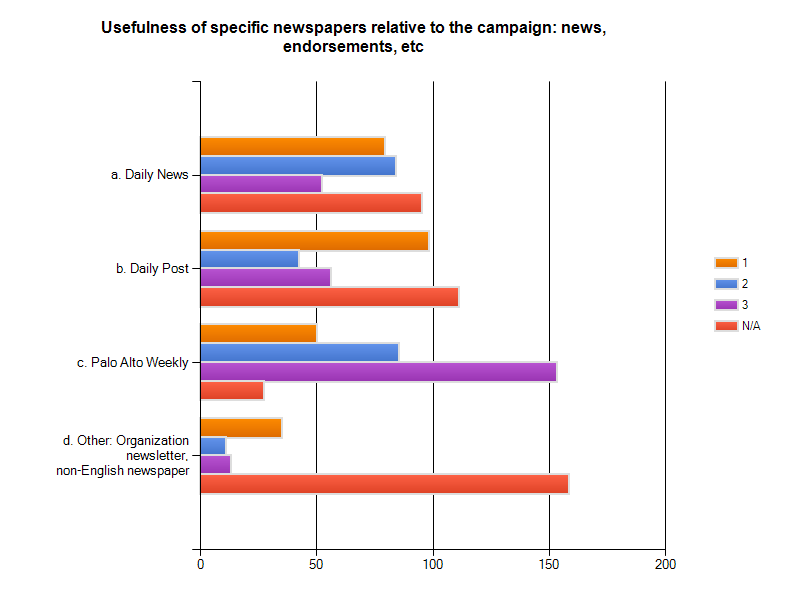
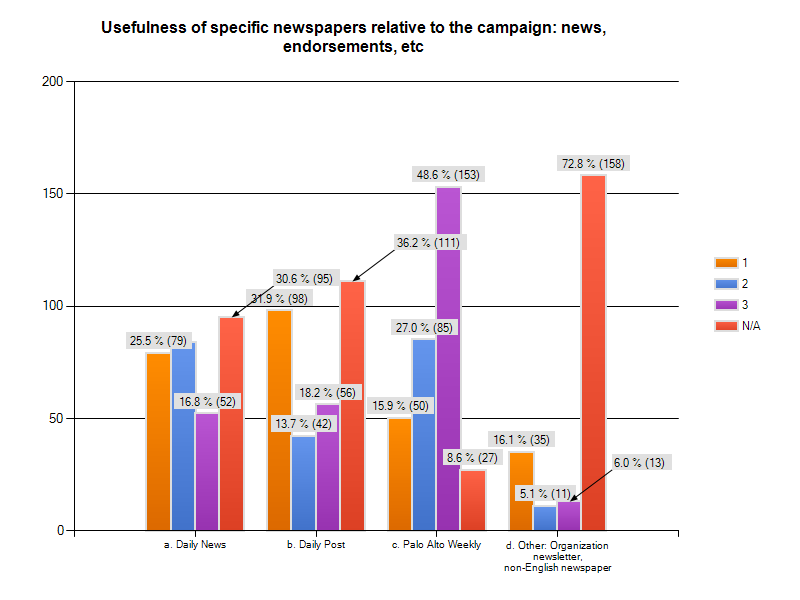
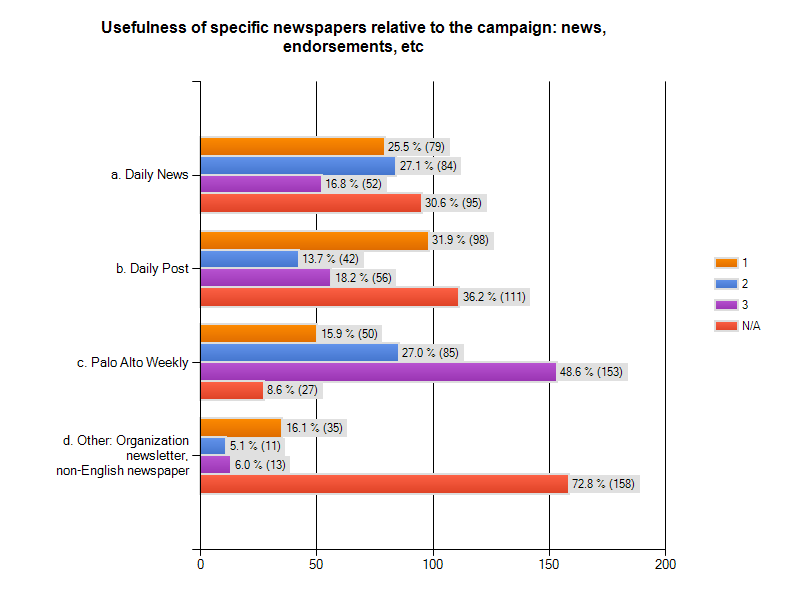
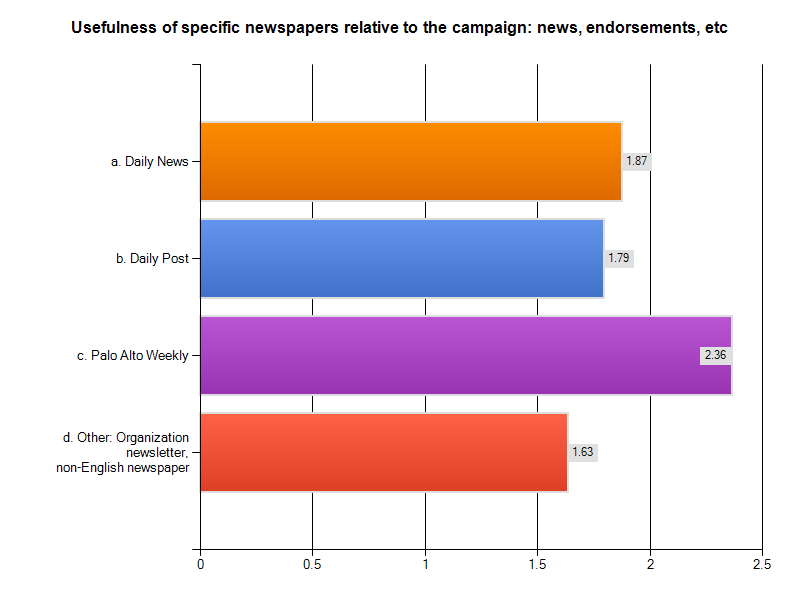
| 9. Usefulness of specific newspapers relative to the campaign: news, endorsements, etc |
| |
answered question |
317 |
|
skipped question |
24 |
| |
1 |
2 |
3 |
N/A |
Rating
Average |
Response
Count |
| a. Daily News |
25.5% (79) |
27.1% (84) |
16.8% (52) |
30.6% (95) |
1.87 |
310 |
| b. Daily Post |
31.9% (98) |
13.7% (42) |
18.2% (56) |
36.2% (111) |
1.79 |
307 |
| c. Palo Alto Weekly |
15.9% (50) |
27.0% (85) |
48.6% (153) |
8.6% (27) |
2.36 |
315 |
| d. Other: Organization newsletter, non-English newspaper |
16.1% (35) |
5.1% (11) |
6.0% (13) |
72.8% (158) |
1.63 |
217 |
| viewIf "Other publication", name(s) |
27 |
Charts:
Per question data: Textual summary
(PDF),
Spreadsheets: summary
(XLS)
and Other
(CSV)
| 10. If you were dissatisfied with any of the above sources of information, please explain. Please identify which source you are commenting on ("candidate coffee", "8a") because these comments will be viewed separately from your ratings. |
| |
answered question |
77 |
|
skipped question |
264 |
| |
Response
Count |
| view |
77 |
Per question data: Textual summary
(PDF),
Spreadsheet
(CSV)
Responses reordered into categories
| 11. Any other comments on these or other sources? Again, please identify the source. |
| |
answered question |
56 |
|
skipped question |
285 |
| |
Response
Count |
| view |
56 |
Per question data: Textual summary
(PDF),
Spreadsheet
(CSV)
Survey Form Page 3: Demographics
We expect certain groups to be over- and under-represented among those taking this survey. This data may support compensating for that.
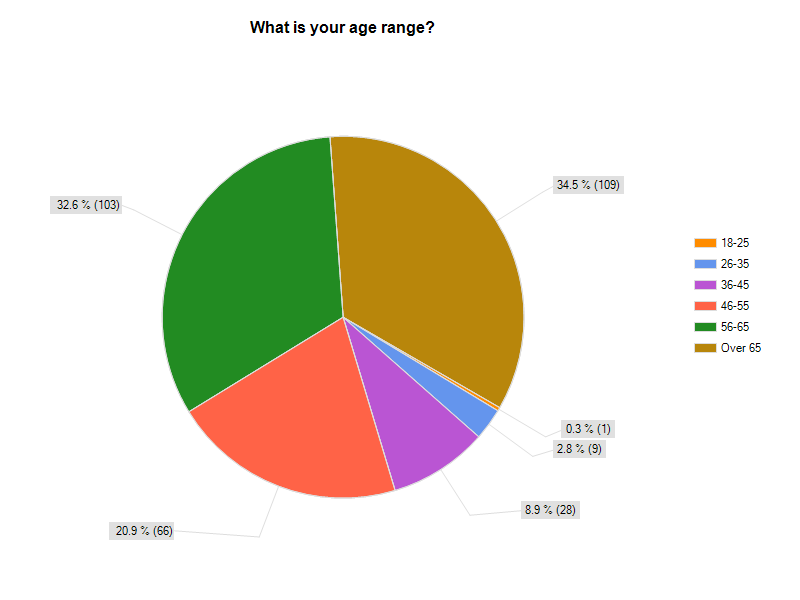
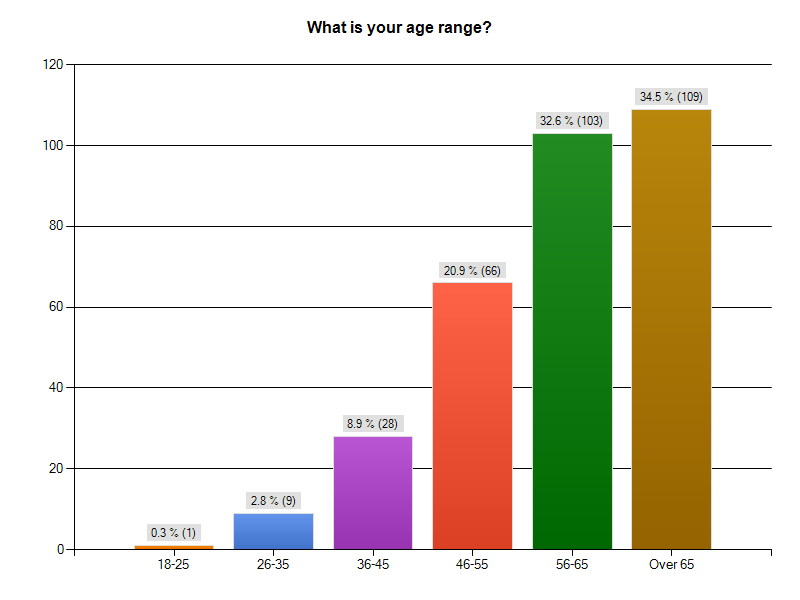
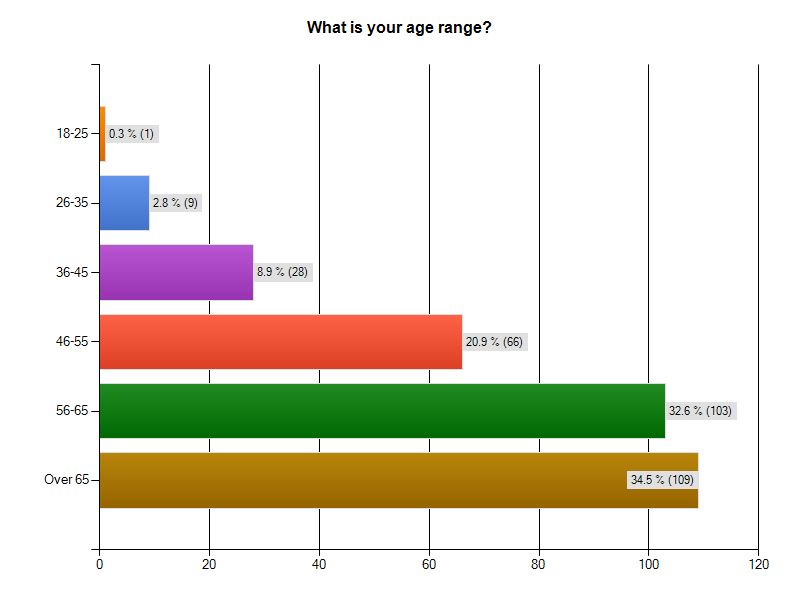
| 12. What is your age range? |
| |
answered question |
316 |
|
skipped question |
25 |
| |
Response
Percent |
Response
Count |
| 18-25 |
|
0.3% |
1 |
| 26-35 |
|
2.8% |
9 |
| 36-45 |
|
8.9% |
28 |
| 46-55 |
|
20.9% |
66 |
| 56-65 |
|
32.6% |
103 |
| Over 65 |
|
34.5% |
109 |
Charts:
Pie,
Column,
Bar
Per question data: Textual summary
(PDF)
Additional information:
Break-down by age and gender of voters (to assess the representativeness of the respondents here).
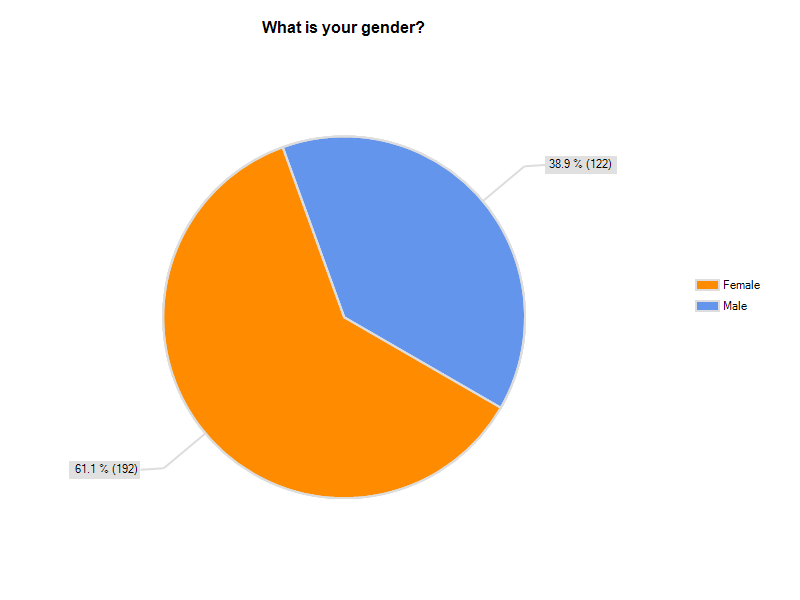
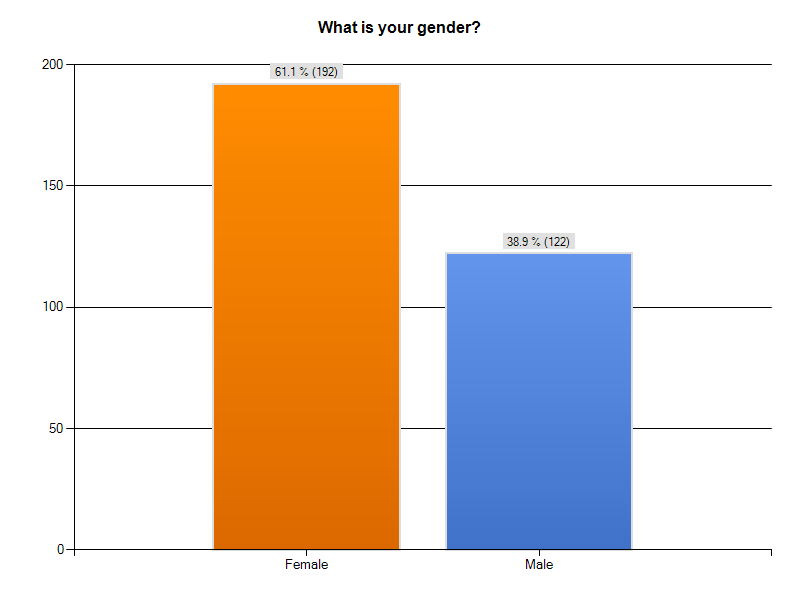
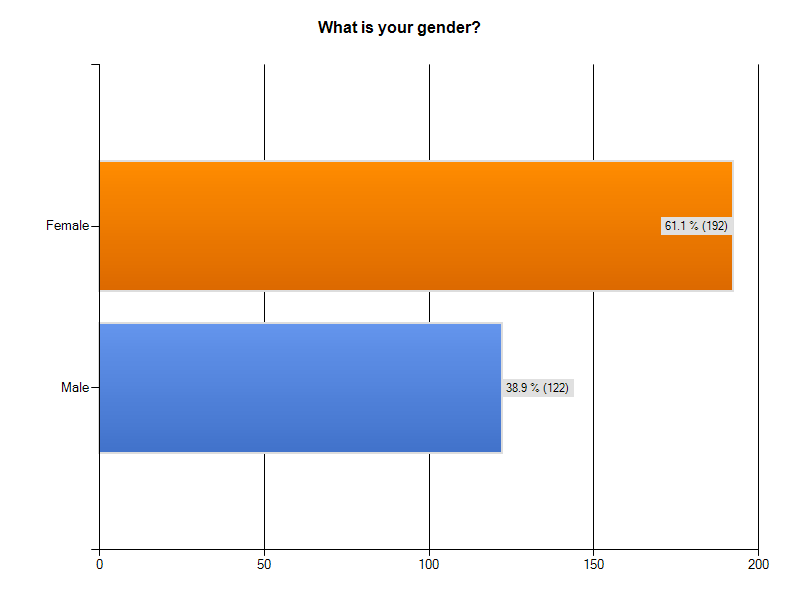
| 13. What is your gender? |
| |
answered question |
314 |
|
skipped question |
27 |
| |
Response
Percent |
Response
Count |
| Female |
|
61.1% |
192 |
| Male |
|
38.9% |
122 |
Charts:
Pie,
Column,
Bar
Per question data: Textual summary
(PDF)
Additional information: In the break-down of all voters, females were 46-59% and males were 41-54% (gender of 13% were unknown).
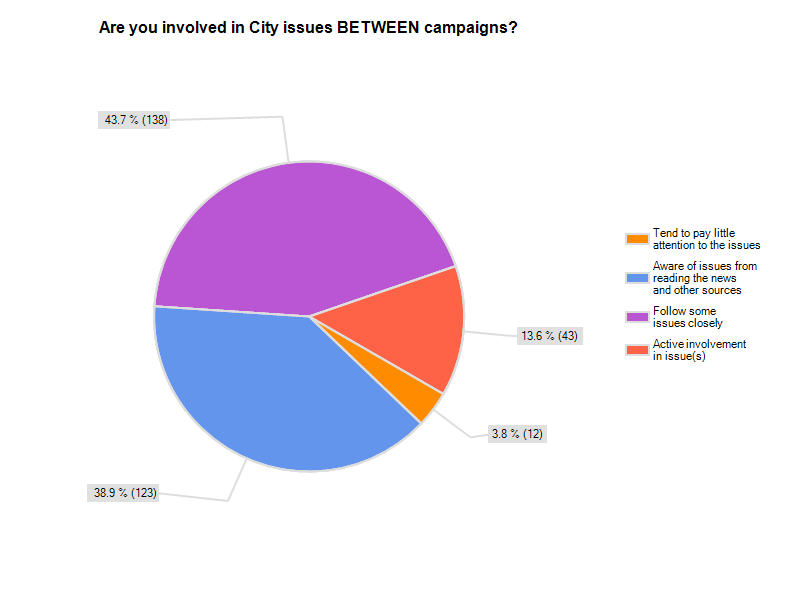
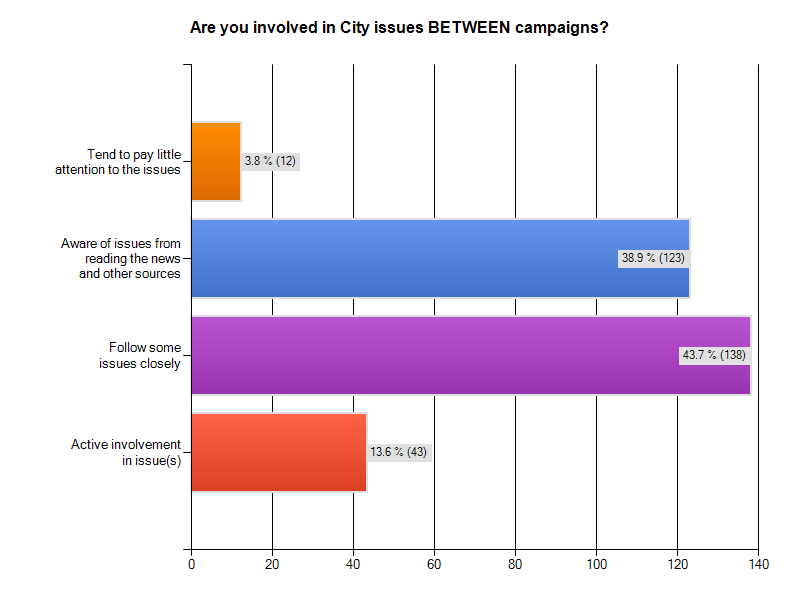
| 14. Are you involved in City issues BETWEEN campaigns? |
| |
answered question |
316 |
|
skipped question |
25 |
| |
Response
Percent |
Response
Count |
| Tend to pay little attention to the issues |
|
3.8% |
12 |
| Aware of issues from reading the news and other sources |
|
38.9% |
123 |
| Follow some issues closely |
|
43.7% |
138 |
| Active involvement in issue(s) |
|
13.6% |
43 |
Charts:
Pie,
Column,
Bar
Per question data: Textual summary
(PDF)
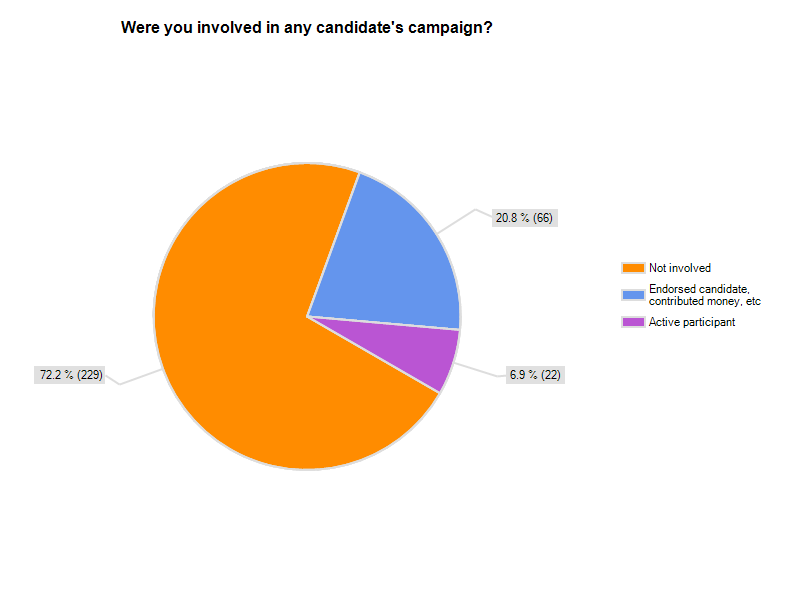
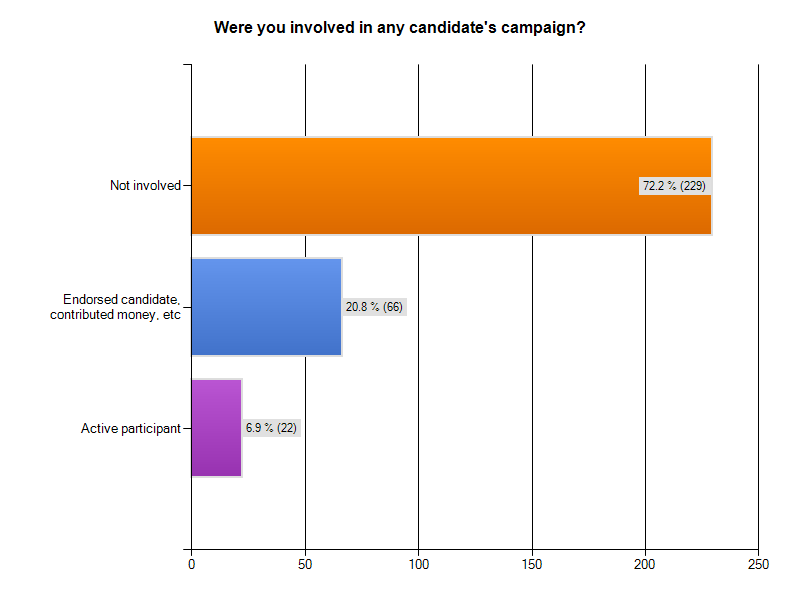
| 15. Were you involved in any candidate's campaign? |
| |
answered question |
317 |
|
skipped question |
24 |
| |
Response
Percent |
Response
Count |
| Not involved |
|
72.2% |
229 |
| Endorsed candidate, contributed money, etc |
|
20.8% |
66 |
| Active participant |
|
6.9% |
22 |
Charts:
Pie,
Column,
Bar
Per question data: Textual summary
(PDF)
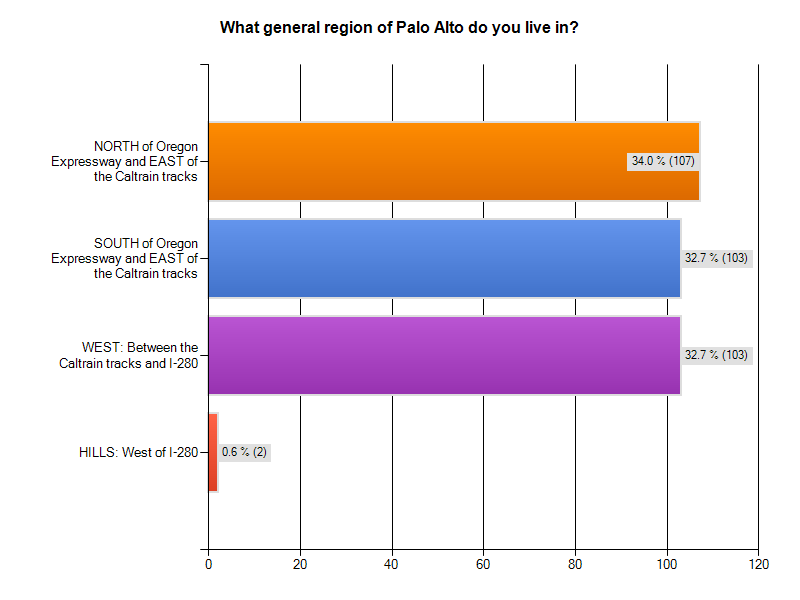
| 16. What general region of Palo Alto do you live in? |
| |
answered question |
315 |
|
skipped question |
26 |
| |
Response
Percent |
Response
Count |
| NORTH of Oregon Expressway and EAST of the Caltrain tracks |
|
34.0% |
107 |
| SOUTH of Oregon Expressway and EAST of the Caltrain tracks |
|
32.7% |
103 |
| WEST: Between the Caltrain tracks and I-280 |
|
32.7% |
103 |
| HILLS: West of I-280 |
|
0.6% |
2 |
Charts:
Pie,
Column,
Bar
Per question data: Textual summary
(PDF)
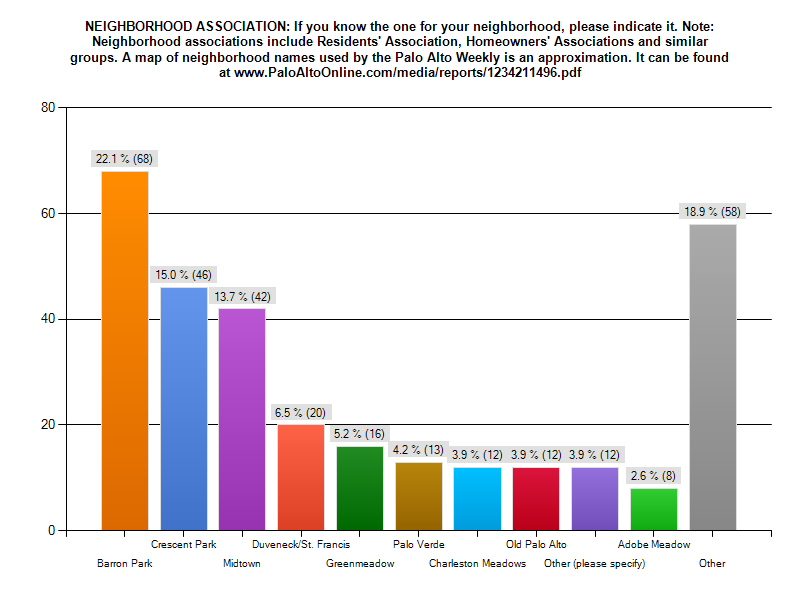
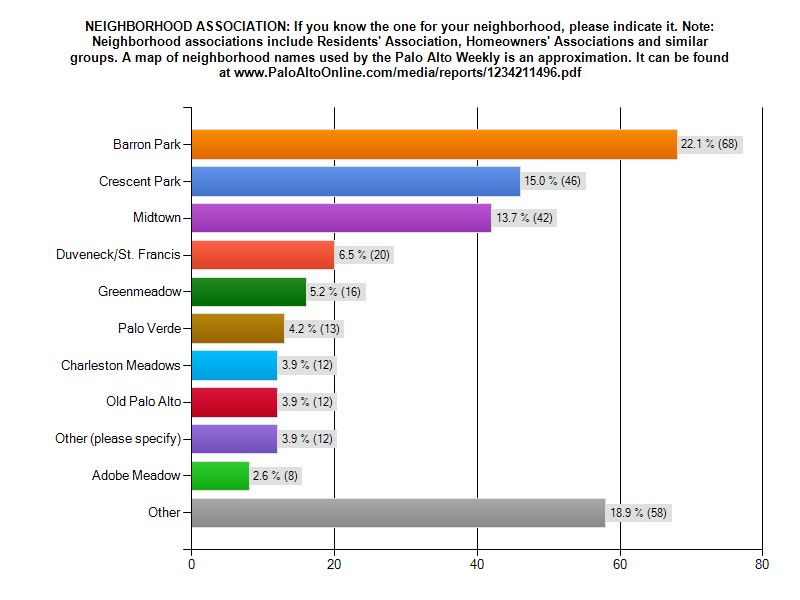
| 17. NEIGHBORHOOD ASSOCIATION: If you know the one for your neighborhood, please indicate it. Note: Neighborhood associations include Residents' Association, Homeowners' Associations and similar groups. A map of neighborhood names used by the Palo Alto Weekly is an approximation. It can be found at www.PaloAltoOnline.com/media/reports/1234211496.pdf |
| |
answered question |
307 |
|
skipped question |
34 |
| |
Response
Percent |
Response
Count |
| Don't Know |
|
2.0% |
6 |
| Adobe Meadow |
|
2.6% |
8 |
| Barron Park |
|
22.1% |
68 |
| Cal-Ventura |
|
0.0% |
0 |
| Charleston Gardens |
|
2.0% |
6 |
| Charleston Meadows |
|
3.9% |
12 |
| Charleston Village HOA |
|
0.0% |
0 |
| College Terrace |
|
2.3% |
7 |
| Community Center |
|
1.0% |
3 |
| Crescent Park |
|
15.0% |
46 |
| Downtown North |
|
1.6% |
5 |
| Duveneck/St. Francis |
|
6.5% |
20 |
| Evergreen Park |
|
0.3% |
1 |
| Fairmeadow |
|
0.7% |
2 |
| Greenacres I |
|
0.3% |
1 |
| Greenacres II |
|
1.6% |
5 |
| The Greenhouse |
|
0.3% |
1 |
| Greenmeadow |
|
5.2% |
16 |
| Leland Manor |
|
2.0% |
6 |
| Mayfield |
|
0.0% |
0 |
| Midtown |
|
13.7% |
42 |
| Miranda |
|
0.3% |
1 |
| Monroe Park |
|
0.3% |
1 |
| Old Palo Alto Corridor |
|
0.3% |
1 |
| Old Palo Alto |
|
3.9% |
12 |
| Palo Altans Protecting Open Space NA |
|
0.0% |
0 |
| Palo Alto Central |
|
0.0% |
0 |
| Palo Alto Hills |
|
0.3% |
1 |
| Palo Alto Orchards |
|
0.0% |
0 |
| Palo Verde |
|
4.2% |
13 |
| Southgate |
|
0.7% |
2 |
| University South |
|
1.6% |
5 |
| Walnut Grove |
|
0.7% |
2 |
| Ventura |
|
0.7% |
2 |
| viewOther (please specify) |
|
3.9% |
12 |
Charts:
Pie,
Column,
Bar
Per question data: Textual summary
(PDF),
Spreadsheets
(XLS)
Half the responses came from three neighborhoods: Barron Park, Crescent Park, and Midtown.
This uneven distribution of neighborhoods is almost certainly a result
of how this survey was publicized.
Summary Tables
Information Sources by average rating
Ave Rating/
% of Scale |
Q# |
Description |
2.36 / 68% |
|
Palo Alto Weekly |
2.30 / 65% |
|
Candidate questionnaires |
2.18 / 59% |
|
Forums attended in person |
2.17 / 59% |
|
Endorsements by newspapers |
2.14 / 57% |
|
Santa Clara County Voters Guide |
2.14 / 57% |
|
Recommendations by friends and family |
2.09 / 55% |
|
Endorsements by community members |
2.04 / 52% |
|
Voters Guide from League of Women Voters |
1.99 / 50% |
|
Candidate coffees and other events |
1.93 / 47% |
|
Endorsements by organizations |
1.87 / 44% |
|
Daily News |
1.84 / 42% |
|
Endorsements by officials |
1.84 / 42% |
|
Other personal contact |
1.81 / 46% |
|
Forums on Web |
1.80 / 45% |
|
Recommendations, misc |
1.79 / 45% |
|
Daily Post |
1.71 / 36% |
|
Forums on cable TV |
1.71 / 36% |
|
SmartVoter website |
1.67 / 34% |
|
Recommendations by 3rd parties |
1.67 / 34% |
|
Brochures via mail |
1.67 / 34% |
|
Candidate door-to-door |
1.63 / 32% |
|
Newspapers, other |
1.62 / 31% |
|
Brochures on doorstep |
1.60 / 30% |
|
Comments in online forums |
1.60 / 30% |
|
Candidate website |
1.57 / 29% |
|
Ads in newspapers |
1.54 / 27% |
|
Sidewalk events |
1.48 / 24% |
|
Candidates' supporters |
1.40 / 20% |
|
Ads on newspaper websites |
1.39 / 20% |
|
Email from candidate |
1.35 / 18% |
|
Lawn signs |
1.18 / 9% |
|
Cable TV commercials |
Information Sources by Very Helpful
Responses
Count |
Q# |
Description |
153 |
|
Palo Alto Weekly |
120 |
|
Endorsements by newspapers |
118 |
|
Candidate questionnaires |
111 |
|
Recommendations by friends and family |
106 |
|
Santa Clara County Voters Guide |
101 |
|
Endorsements by community members |
71 |
|
Endorsements by organizations |
71 |
|
Forums attended in person |
70 |
|
Voters Guide from League of Women Voters |
59 |
|
Candidate coffees and other events |
57 |
|
Endorsements by officials |
56 |
|
Daily Post |
52 |
|
Daily News |
42 |
|
Brochures via mail |
41 |
|
Brochures on doorstep |
41 |
|
Forums on Web |
40 |
|
Recommendations of 3rd parties |
40 |
|
Comments in online forums |
36 |
|
Ads in newspapers |
33 |
|
Candidate website |
33 |
|
SmartVoter website |
28 |
|
Forums on cable TV |
28 |
|
Candidate door-to-door |
24 |
|
Recommendations, misc |
24 |
|
Ads on newspaper websites |
22 |
|
Lawn signs |
21 |
|
Email from candidate |
19 |
|
Candidates' supporters |
16 |
|
Sidewalk events |
15 |
|
Other personal contact |
13 |
|
Newspapers, other |
10 |
|
Cable TV commercials |
Remember that the Average Rating is based upon ratings on the scale of 1 to 3
and does not include responses of N/A
.
Consequently, the averages can be based upon a minority, even a small minority, of those who took the survey.
Tables categorizing the responses to free-form responses:
Question 2 (Top 5 sources)
and Question 10 (Dissatisfaction with sources)
(also referenced under those questions above).
Observations
The dominance of the Palo Alto Weekly leaps out of the above tables
(including that for Question 2 Top 5 sources).
But candidate questionnaires have a surprisingly strong showing, given their limited publicity/distribution.
Dissatisfaction with the quality and quantity of information about the candidates is evident in this survey.
Notice that only 8 of the 32 information sources averaged above a 2 on the 1-to-3 scale,
and those averages included only those who chose to use those sources.
In this campaign, the candidates themselves contributed greatly to this dissatisfaction.
I heard from one of the people involved in candidate interviews at a newspaper
that they couldn't get the candidates to say much beyond their pre-planned talking points.
A September 28 editorial in the Daily Post by Diana Diamond entitled The candidates need to drop the platitudes
was directed at the candidates' presentations at their own events.
Candidates need to ask themselves if playing safe
isn't actually costing them more votes
than are at risk from taking positions on the issues.
Publicity inadequacies:
In question 10 (Dissatisfaction
) there are several comments from people not knowing about the forums
and the rebroadcasts and web viewing.
Adequate publicity for candidate events and resources has been a problem now for several elections.
Because traditional sources such as the newspapers and the League of Woman Voters are not providing this information,
or providing it only belatedly,
the Palo Alto Neighborhoods (PAN) website has provided listings and links,
but this is not a heavily trafficked website,
and even people who knew this information was there did not remember that when they went looking for such.
Example: In its press release announcing the availability of the responses to the questionnaire, PAN provided a quote from Council member Espinosa intended to help reporters with a highlight for their story, but there was minimal/no coverage in the newspapers. The Espinosa quote was If you want to know what's important to Palo Altans today, read the PAN questionnaire. I have told council candidates that no other survey will better prepare them for the breadth of issues covered during the campaign or their council service. The PAN questionnaire hits nearly every hot issue facing the city today.
Forum rebroadcasts (6b&6c):
There is a noticeable preference for viewing the forum on the Web vs. on cable TV,
with the primary difference in those who rated it a 3 (most useful
).
This could be a result of the Web providing built-in pause and replay,
or it could be a side-effect of who preferred which media.
In any case, both forms of rebroadcast rank above many other information sources
and seem to be worth the efforts by their sponsors.
Candidate Brochures: mail vs. doorstep (5d vs. 5e):
In previous elections, there was significant anecdotal reporting of voters ignoring candidate brochures that came in the mail
but valuing them when dropped on their doorstep.
In this survey, mail has a slightly higher ranking.
Although the brochures have a very low rating and come in for extensive criticism in Q10 (Dissatisfied
) (categorized version),
roughly a quarter of the respondents listed them in Q2 (Top 5 Sources) (categorized version).
Notice that while 85 people listed them in Q2,
only 41/42 people rated them very useful
(in Q5).
An explanation might be found not in its absolute rating, but its rating relative to the other sources.
Lawn signs (4a):
There is significant anecdotal reporting that lawn signs can be very influential
when placed in front of the homes of people who are well-known for their involvement
and whose opinions are respected.
Yet lawn signs received the second lowest rating of all the information sources
(only the virtually non-existent cable TV commercials ranked lower).
One interpretation is that,
even if the respondent were to be influenced by signs at one or two locations,
that respondent could judge lawn signs as an overall group to have little/no influence.
Another interpretation is that the anecdotal reporting represents exceptional cases
rather than representatives of a broader group.
Candidates have been known to spend considerable time trying to get their signs
in high-visibility, high-traffic locations,
and this results suggests that such efforts may not have a proportionate payoff.
Aside (Anecdotal evidence): In discussions of lawn signs during this campaign,
comments were routinely heard about the many incomprehensible—seemingly contradictory—combinations of lawn signs seen around the city.
For a typical voter, recognizing a few such situations could easily cause them to discount all lawn signs,
with the possible exception those of people known to them.
Aphorisms: It's the quality not the quantity. It's not the location, but the person at that location.
An alternate perspective on the role of lawn signs is that they are primarily to avoid a negative,
that is, voters might infer from an absence of signs that the candidate hasn't garnered enough support to be worth considering.
Such an effect would not be measured in this survey.
Voters Guide from Santa Clara County Registrar of Voters (7):
A hint of the importance of the Guide comes from the 2007 City Council election:
Although candidate Debbie Mytels dropped out in August,
only a few weeks after declaring her candidacy, she finished seventh at the polls.
She did virtually no campaigning other than filing the ballot statement that was published in this pamphlet,
but she had name recognition, including as a neighborhood activist (Midtown) and as Associate Director of Acterra.
The election was for four seats and she received almost half as many votes as the fourth place finisher.
Near final vote totals:
Espinosa 8469;
Burt 7501;
Yeh 7379;
Schmid 5585;
Dykwel 4718;
Ross 3043;
Mytels 2634;
Gray 1920;
Wallace 1873;
Nadim 1440;
Marinos 1008;
Frost 778.